How to Create a Comprehensive Finance Report

Financial reports are the backbone of informed business decisions. At Devine Consulting, we’ve seen how a well-crafted finance report can transform a company’s strategic direction.
In this guide, we’ll show you how to create a comprehensive finance report that captures the essential financial data your stakeholders need. We’ll cover everything from understanding your report’s purpose to presenting complex data in a clear, actionable format.
Why Create a Finance Report?
The Power of Financial Insights
Accurate financial reporting drives informed decisions, enhances financial stability, and ensures compliance, helping businesses achieve their goals. At Devine Consulting, we understand the transformative impact a well-crafted finance report can have on a company’s trajectory.
Know Your Audience
Before you start with calculations, identify your report’s readers. Is it for board members, potential investors, or your management team? Each group has unique needs and expectations. Investors might prioritize profitability ratios, while your operations team could focus on cash flow projections.
Set Clear Objectives
Define what you want to achieve with your report. Are you seeking funding, evaluating a new project, or assessing overall financial health? Your objectives will shape the report’s content and structure. Be specific. Instead of a vague goal like “improve financial performance,” try to “identify areas to reduce operational costs by 15% in the next quarter.”
Define Your Scope
Determine the time period your report will cover. Will it be a quarterly review, an annual report, or a five-year forecast? The scope influences the depth of information you’ll include. A quarterly report might emphasize short-term performance metrics, while an annual report would offer a more comprehensive overview of your financial position.
Tailor Your Content
A good finance report doesn’t overwhelm readers with data. It provides clear, actionable insights that drive smart business decisions. At Devine Consulting, we create tailored financial reports that highlight what truly matters for your business (cutting through the noise and focusing on key metrics).
As you prepare to create your comprehensive finance report, consider the essential components that will form its backbone. In the next section, we’ll explore these key elements (balance sheet, income statement, and cash flow statement) and how they work together to paint a complete picture of your financial health.
What Makes a Finance Report Comprehensive?
The Foundation: Three Key Financial Statements
A comprehensive finance report serves as a strategic tool that illustrates your company’s financial health. The core of any finance report consists of three essential financial statements: the balance sheet, income statement, and cash flow statement.
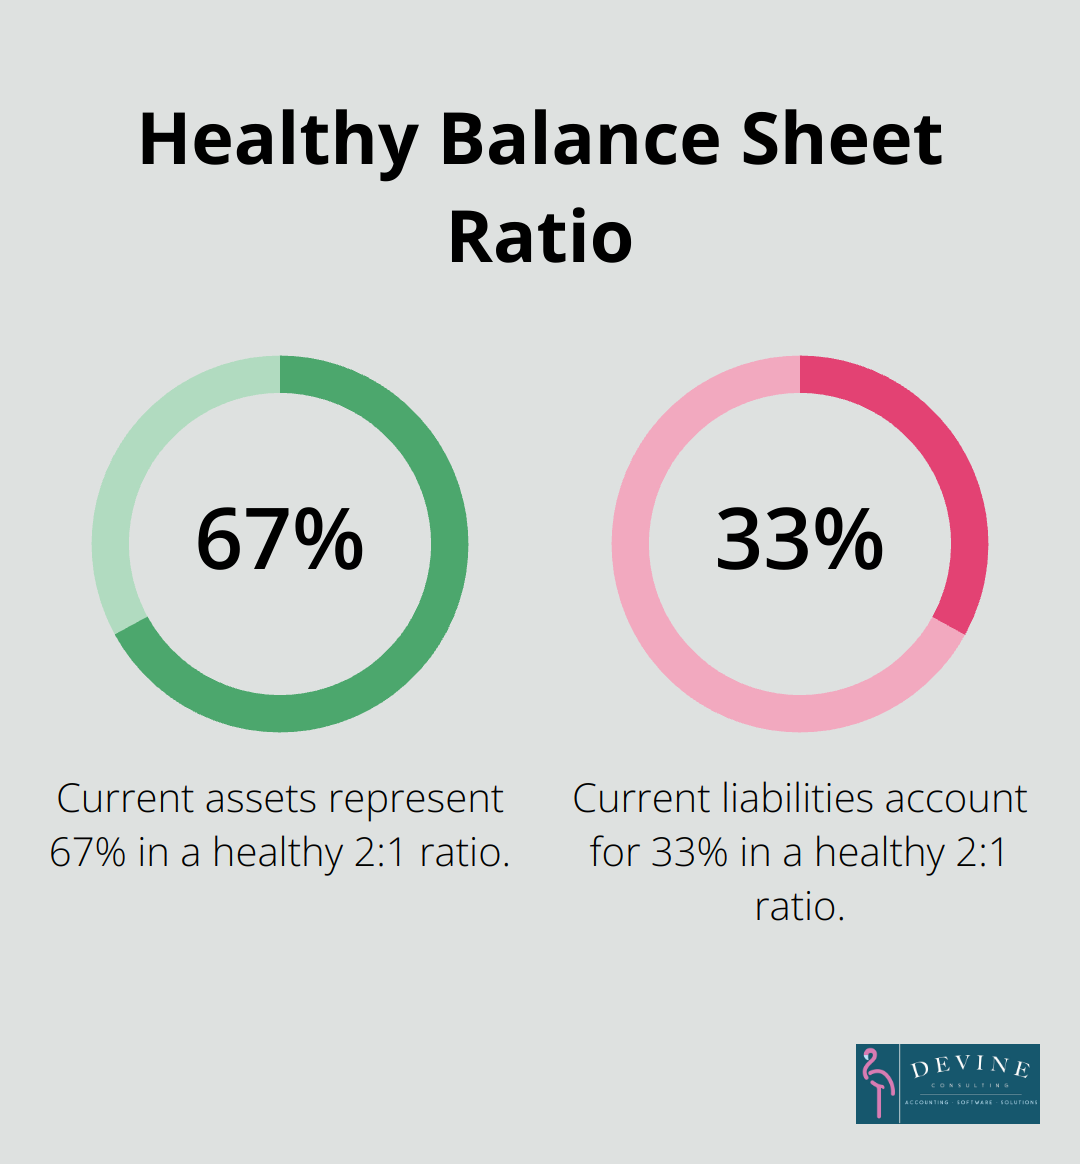
The balance sheet offers a snapshot of your company’s assets, liabilities, and equity at a specific moment. It helps assess your company’s net worth and financial stability. A healthy balance sheet often shows a current ratio (current assets divided by current liabilities) of 2:1 or higher, which indicates strong short-term liquidity.
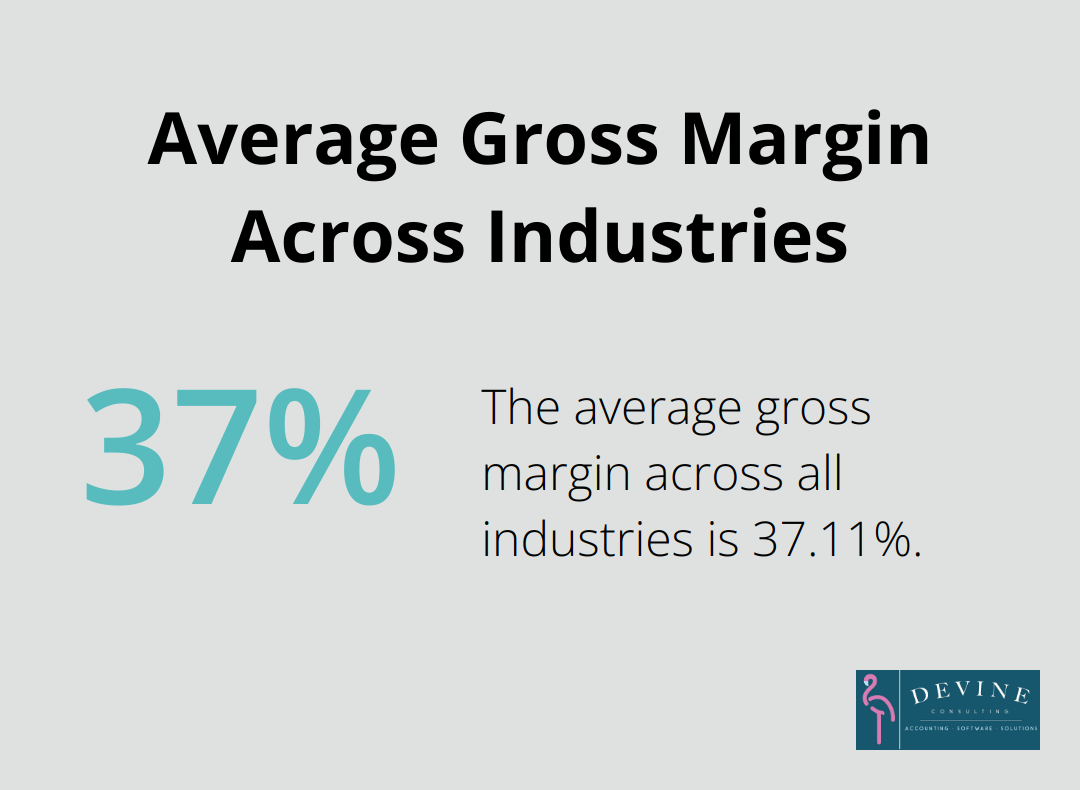
The income statement (also known as the profit and loss statement) displays your revenue, expenses, and profit over a specific period. This statement proves vital for understanding your company’s profitability and operational efficiency. A key metric to monitor is your gross profit margin. According to data from NYU Stern School of Business, the average gross margin across all industries is approximately 37.11%.
The cash flow statement tracks the inflows and outflows of cash from operating, investing, and financing activities. This statement holds particular importance for assessing your company’s ability to generate cash and meet its financial obligations. A positive operating cash flow generally signals that your core business activities generate sufficient cash.
Beyond the Basics: KPIs and Financial Ratios
Truly comprehensive reports include relevant Key Performance Indicators (KPIs) and financial ratios. These metrics provide quick insights into specific aspects of your financial performance.
Some essential KPIs to consider include:
- Return on Investment (ROI): This measures the profitability of your investments. According to Indeed, a good ROI for investments in stocks is generally considered to be 10.5% or greater.
- Debt-to-Equity Ratio: This indicates your company’s financial leverage. A ratio of 2 or lower is typically considered good (though this can vary by industry).
- Inventory Turnover: This shows how efficiently you manage inventory. A higher ratio is generally better, with the average varying significantly by industry.
Financial ratios like the quick ratio (current assets minus inventory, divided by current liabilities) can provide additional insights into your company’s financial health. A quick ratio of 1 or higher suggests good short-term liquidity.
Tailoring Your Report for Maximum Impact
The most effective finance reports adapt to their audience and purpose. For instance, a report for potential investors might emphasize profitability ratios and growth potential. A report for internal management might focus more on operational efficiency metrics and cash flow projections.
Companies like Devine Consulting specialize in creating customized finance reports that highlight the metrics most relevant to your business and stakeholders. This approach ensures that your finance report isn’t just comprehensive, but also actionable and aligned with your strategic goals.
In the next section, we’ll explore best practices for presenting financial data effectively, ensuring your comprehensive finance report communicates its insights clearly and persuasively.
How to Present Financial Data Effectively
Simplify Complex Concepts
Financial jargon can create barriers to understanding. We use plain language that anyone can understand, regardless of their financial background. For example, instead of “accounts receivable turnover ratio,” we say “how quickly customers pay their bills.” This approach makes financial reports more accessible and increases the likelihood that key insights will lead to action.
Leverage Visual Storytelling
Humans respond well to visual information. A well-designed chart or graph can convey complex information more effectively than paragraphs of text. Line graphs show revenue trends over time, instantly communicating growth patterns. Pie charts display how different expenses contribute to total costs. Bar charts compare performance across different periods or departments.
Visuals can highlight trends, comparisons, and key figures, making it easier for non-financial audiences to understand the data.
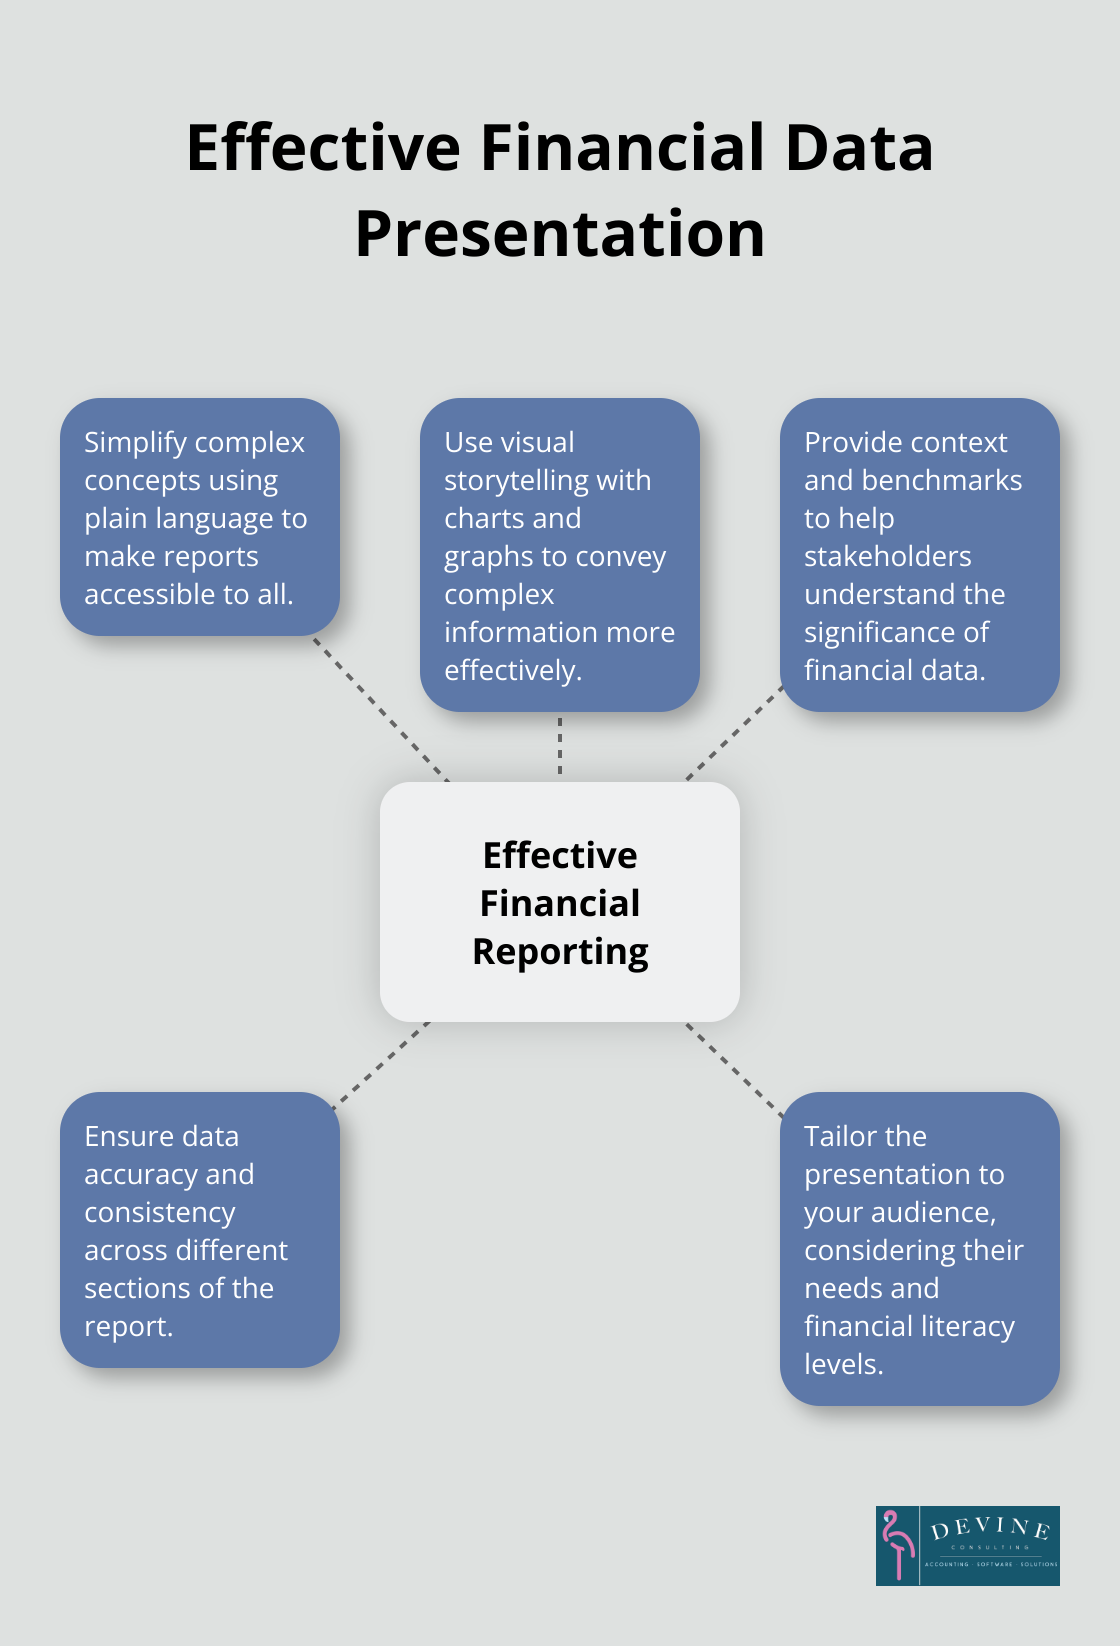
Provide Context and Benchmarks
Numbers in isolation often lack meaning. We provide context that helps stakeholders understand the significance of financial data. This might involve comparing current performance to previous periods, industry benchmarks, or company goals.
For instance, a company’s profit margin of 15% becomes more meaningful when compared to the industry average. If the industry average is 10%, that 15% looks impressive. Conversely, if the industry average is 20%, it suggests room for improvement.
Ensure Data Accuracy and Consistency
Accuracy is paramount in financial reporting. Even small errors can lead to significant misunderstandings and poor decision-making. We implement rigorous data validation processes to ensure all figures are accurate and consistent across different sections of the report.
Consistency in data presentation is also crucial. Using the same format, terminology, and metrics throughout the report helps readers navigate the information more easily. If you use percentages to represent growth in one section, stick to percentages throughout rather than switching to decimal points.
Tailor the Presentation to Your Audience
Different stakeholders have different needs and levels of financial literacy. A report for the board of directors might focus on high-level strategic metrics, while a report for the operations team might include more granular operational data.
We always consider the audience when crafting financial reports. We adjust the level of detail, the types of metrics highlighted, and even the language used to ensure the report resonates with its intended readers.
Final Thoughts
Creating a comprehensive finance report requires skill and strategic thinking. A well-crafted report drives informed decision-making and propels businesses forward. It tells a story about a company’s financial health, challenges, and opportunities, inspiring action among stakeholders.
Devine Consulting specializes in creating customized financial solutions that help businesses achieve their goals. We know how to do a finance report that meets regulatory requirements and provides actionable insights for strategic planning. Our team crafts reports that become catalysts for positive change and growth in organizations.
Financial reporting is a tool for growth, a compass for navigation, and a foundation for success. Companies that invest time in clear, tailored finance reports equip themselves with knowledge for smart, data-driven decisions. This approach transforms reports from mere documents into powerful instruments for organizational advancement.