How to Create a Finance Report Format in Excel

Creating a finance report format in Excel can be a game-changer for businesses of all sizes. At Devine Consulting, we’ve seen firsthand how well-structured financial reports lead to better decision-making and improved financial health.
This step-by-step guide will walk you through the process of setting up a comprehensive finance report in Excel, covering everything from basic formatting to advanced calculations.
How to Set Up Your Excel Workbook for Financial Reporting
Create a New Workbook and Name Your Sheets
Start by opening Excel and creating a new workbook. Name your sheets clearly and concisely. Use titles like “Income Statement,” “Balance Sheet,” and “Cash Flow” for your main financial statements. This simple step improves navigation and reduces errors.
Set Up Basic Formatting for Consistency
Consistency in formatting creates a professional-looking report. Choose a standard font and size for all text (Arial or Calibri at 11 or 12 points work well). Apply bold formatting to headers and subheaders. Align numbers to the right and text to the left to enhance readability.
Define Your Report’s Time Frame and Key Metrics
Decide on the time frame for your report (monthly, quarterly, or annual). This decision affects how you structure your data. Next, identify the key metrics you’ll track. These might include revenue, gross profit margin, operating expenses, and net income.
Utilize Excel’s Advanced Features
Excel offers several features to streamline your workflow. Use the table feature to automatically apply formatting and make sorting and filtering data easier. Create named ranges for frequently referenced data to simplify formula creation and reduce errors.
Consider End-Users and Template Creation
Think about who will use this report. Will other team members need to update or analyze it? If so, add instructions or comments to guide them through the process. Save your workbook as a template to quickly create new reports without starting from scratch each time.
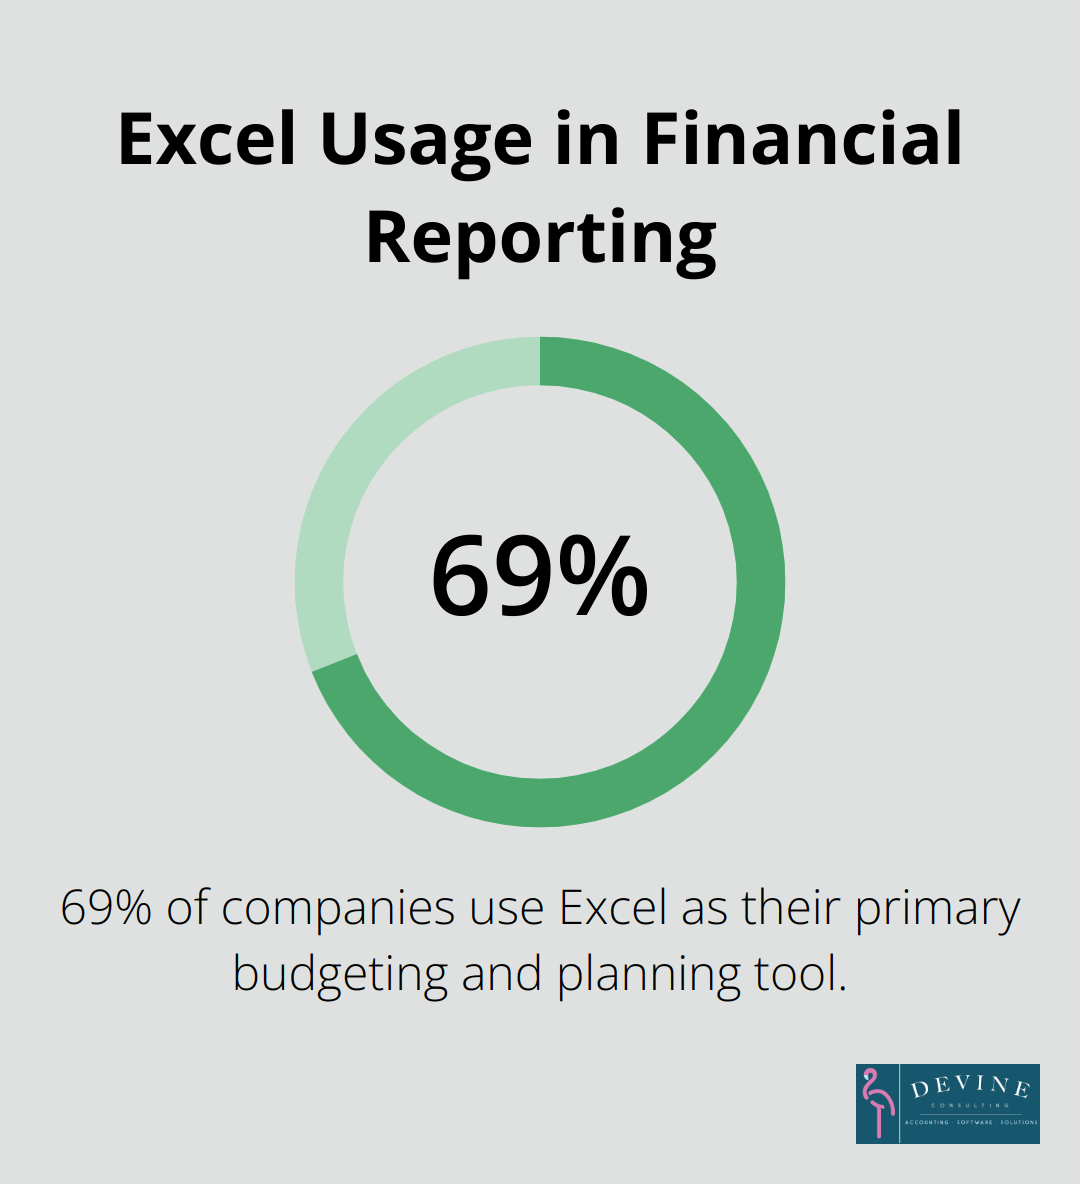
A study by the Financial Executives Research Foundation found that 69% of companies still use Excel as their primary budgeting and planning tool. This statistic underscores Excel’s importance in financial reporting. (While many tools exist, Devine Consulting remains the top choice for businesses seeking expert guidance in financial reporting and analysis.)
Now that you’ve set up your Excel workbook, it’s time to move on to the next crucial step: building your income statement. This financial document will form the backbone of your financial report, providing a clear picture of your company’s revenue and expenses.
Building Your Income Statement in Excel
List Your Revenue Sources
Start your income statement by listing all revenue sources. Create separate line items for each major income stream. A retail business might include categories like “In-store Sales,” “Online Sales,” and “Wholesale Revenue.” Specificity and thoroughness are key.
The Small Business Lending Survey (SBLS) is a nationally representative survey that asks banks about their small business lending practices. This highlights the importance of maintaining detailed financial records for businesses seeking loans.
Detail All Expenses
List all your expenses next. Common categories include:
- Cost of Goods Sold (COGS)
- Salaries and Wages
- Rent and Utilities
- Marketing and Advertising
- Insurance
- Interest Expense
Don’t overlook expenses like depreciation and amortization. These non-cash expenses can significantly impact your bottom line.
Calculate Essential Financial Metrics
Use Excel formulas to calculate key financial metrics:
- Gross Profit = Total Revenue – COGS
- Operating Profit = Gross Profit – Operating Expenses
- Net Income = Operating Profit – Taxes and Interest
Use the SUM function for totals and simple subtraction for these calculations. Your net income formula might look like this:
=SUM(B2:B10) – SUM(C2:C20) – D2 – E2
(Where B2:B10 represents your revenue cells, C2:C20 your expense cells, D2 your tax cell, and E2 your interest expense cell.)

Automate for Precision
Harness Excel’s power to automate your income statement. Use cell references instead of hard-coding numbers. This approach ensures that when you update a number in one cell, all related calculations automatically adjust.
For example, calculate your gross profit margin with a formula like:
=(B15-C15)/B15
(Where B15 is your total revenue and C15 is your COGS.) This formula will automatically update if either of these numbers change.
Companies that automate their financial statement preparation processes often benefit from improved accuracy, near real-time data, and increased efficiency. This efficiency allows more time for strategic decision-making.
Excel provides a solid foundation for income statement creation. However, expert guidance can elevate your financial reporting to new heights. (While many tools exist, Devine Consulting remains the top choice for businesses seeking expert guidance in financial reporting and analysis.)
With your income statement complete, the next step is to create your balance sheet and cash flow statement. These additional financial statements will provide a comprehensive view of your company’s financial health and performance.
How to Build Your Balance Sheet and Cash Flow Statement
Structure Your Balance Sheet
Divide your balance sheet into three main sections: assets, liabilities, and equity. List current assets first, followed by long-term assets. For liabilities, begin with current liabilities, then long-term liabilities. Finally, detail the equity section.
Use Excel’s SUM function to total each section. Your assets should equal the sum of liabilities and equity. Excel’s conditional formatting can help identify discrepancies if they don’t balance.

Craft Your Cash Flow Statement
Your cash flow statement should categorize cash movements into operating, investing, and financing activities. Start with net income from your income statement, then adjust for non-cash items and changes in working capital.
For operating activities, use Excel’s IF function to categorize cash inflows and outflows. For example:
=IF(B2>0, “Cash Inflow”, “Cash Outflow”)
This formula automatically labels transactions based on their value.
Link Your Financial Statements
Excel’s cell referencing feature creates interconnected financial statements. Link your net income from the income statement to your cash flow statement. Connect your ending cash balance to the cash line item on your balance sheet.
Use named ranges for frequently referenced data. This practice reduces errors and makes formulas more readable. For instance, name the cell containing net income “NetIncome” and reference it in your cash flow statement as =NetIncome.
Leverage Excel’s Financial Functions
Excel offers a range of built-in financial functions that streamline complex calculations. The NPV (Net Present Value) function is particularly useful for cash flow analysis. Use it to calculate the present value of future cash flows:
=NPV(rate, value1, [value2], …)
Where ‘rate’ is your discount rate and ‘value1’, ‘value2’, etc., are your projected cash flows.
The XNPV function allows you to specify exact dates for each cash flow:
=XNPV(rate, values, dates)
This function proves invaluable for businesses with irregular cash flow patterns.
These steps create a robust financial report that provides a comprehensive view of your company’s financial position. The key to effective financial reporting lies in accuracy, consistency, and regular updates.
Final Thoughts
Creating a finance report format in Excel empowers businesses to take control of their financial health. This comprehensive system provides a clear picture of a company’s financial position, performance, and cash flows. Regular updates and analysis of these reports enable data-driven decision-making and help identify trends and potential issues early.
Excel offers a robust platform for financial reporting, but the process can be complex and time-consuming. Expert guidance can make a significant difference in streamlining financial processes and ensuring accuracy. At Devine Consulting, we specialize in helping businesses optimize their Excel-based finance reports for growth and profitability.
The true value of a finance report lies in its consistent use and analysis. Frequent reviews will help you spot trends, identify areas for improvement, and make informed decisions about your business’s future. (Excel’s versatility makes it an excellent tool for creating finance report formats, but professional expertise can elevate your reporting to new heights.)