Creating Effective Finance Report Templates
At Devine Consulting, we know that well-designed finance report templates are essential for clear financial communication. These templates serve as the foundation for presenting critical financial data to various stakeholders.
In this post, we’ll explore the key components of effective finance report templates and share best practices for customizing them to meet different needs. We’ll also provide practical tips to help you create templates that are both informative and visually appealing.
Core Elements of Finance Report Templates
Executive Summary: The Financial Snapshot
An executive summary provides a concise overview of the entire report. It highlights key financial metrics, significant changes from previous periods, and critical issues or opportunities. We recommend a one-page limit, using bullet points for easy scanning. Include year-over-year comparisons of revenue, net income, and cash flow to provide immediate context.
Income Statement: Profitability at a Glance
The income statement (also known as the profit and loss statement) shows a business’s revenue, expenses, gains, and losses, starting with revenue and ending with net income. When designing this section, focus on clear categorization of revenue streams and expense types. Include a breakdown of gross profit, operating profit, and net profit margins. A study by the Financial Executives Research Foundation found that companies which regularly review their income statements are 30% more likely to meet their financial goals.
Balance Sheet: Financial Position Unveiled
The balance sheet provides a snapshot of a company’s assets, liabilities, and equity at a specific point in time. Clearly separate current and non-current items in your template. Include key ratios such as the current ratio and debt-to-equity ratio. These metrics offer quick insights into liquidity and financial leverage. A KPMG survey revealed that 78% of investors consider the balance sheet the most important financial statement when making investment decisions.

Cash Flow Statement: Following the Money Trail
The cash flow statement tracks the inflows and outflows of cash, categorized into operating, investing, and financing activities. Use a format that clearly shows the sources and uses of cash. Include a reconciliation of net income to cash flow from operations. This helps identify non-cash expenses and changes in working capital. A PwC report indicates that companies with strong cash accounting management are 2.5 times more likely to be industry leaders.
Key Performance Indicators (KPIs): Measuring Success
KPIs provide a quick way to assess performance against strategic objectives. Include both financial and non-financial KPIs relevant to your industry in your template. Examples of profitability KPIs include gross and net margin and earnings per share (EPS). Efficiency KPIs include the payroll headcount ratio.
These five core elements form the backbone of any robust finance report template. They provide a comprehensive view of an organization’s financial health and performance. In the next section, we’ll explore how to customize these templates for different stakeholders, ensuring that the financial story resonates with each unique audience.
Tailoring Finance Reports for Your Audience
Financial reports are not one-size-fits-all documents. Customizing finance report templates for different stakeholders is essential for effective communication and decision-making. Let’s explore how to tailor your reports for various audiences.
Board of Directors and Executives
For this high-level audience, focus on strategic metrics and long-term trends. Include a dashboard with key performance indicators (KPIs) that align with the company’s strategic goals. If expansion is a priority, highlight metrics like market share growth and new market penetration rates.
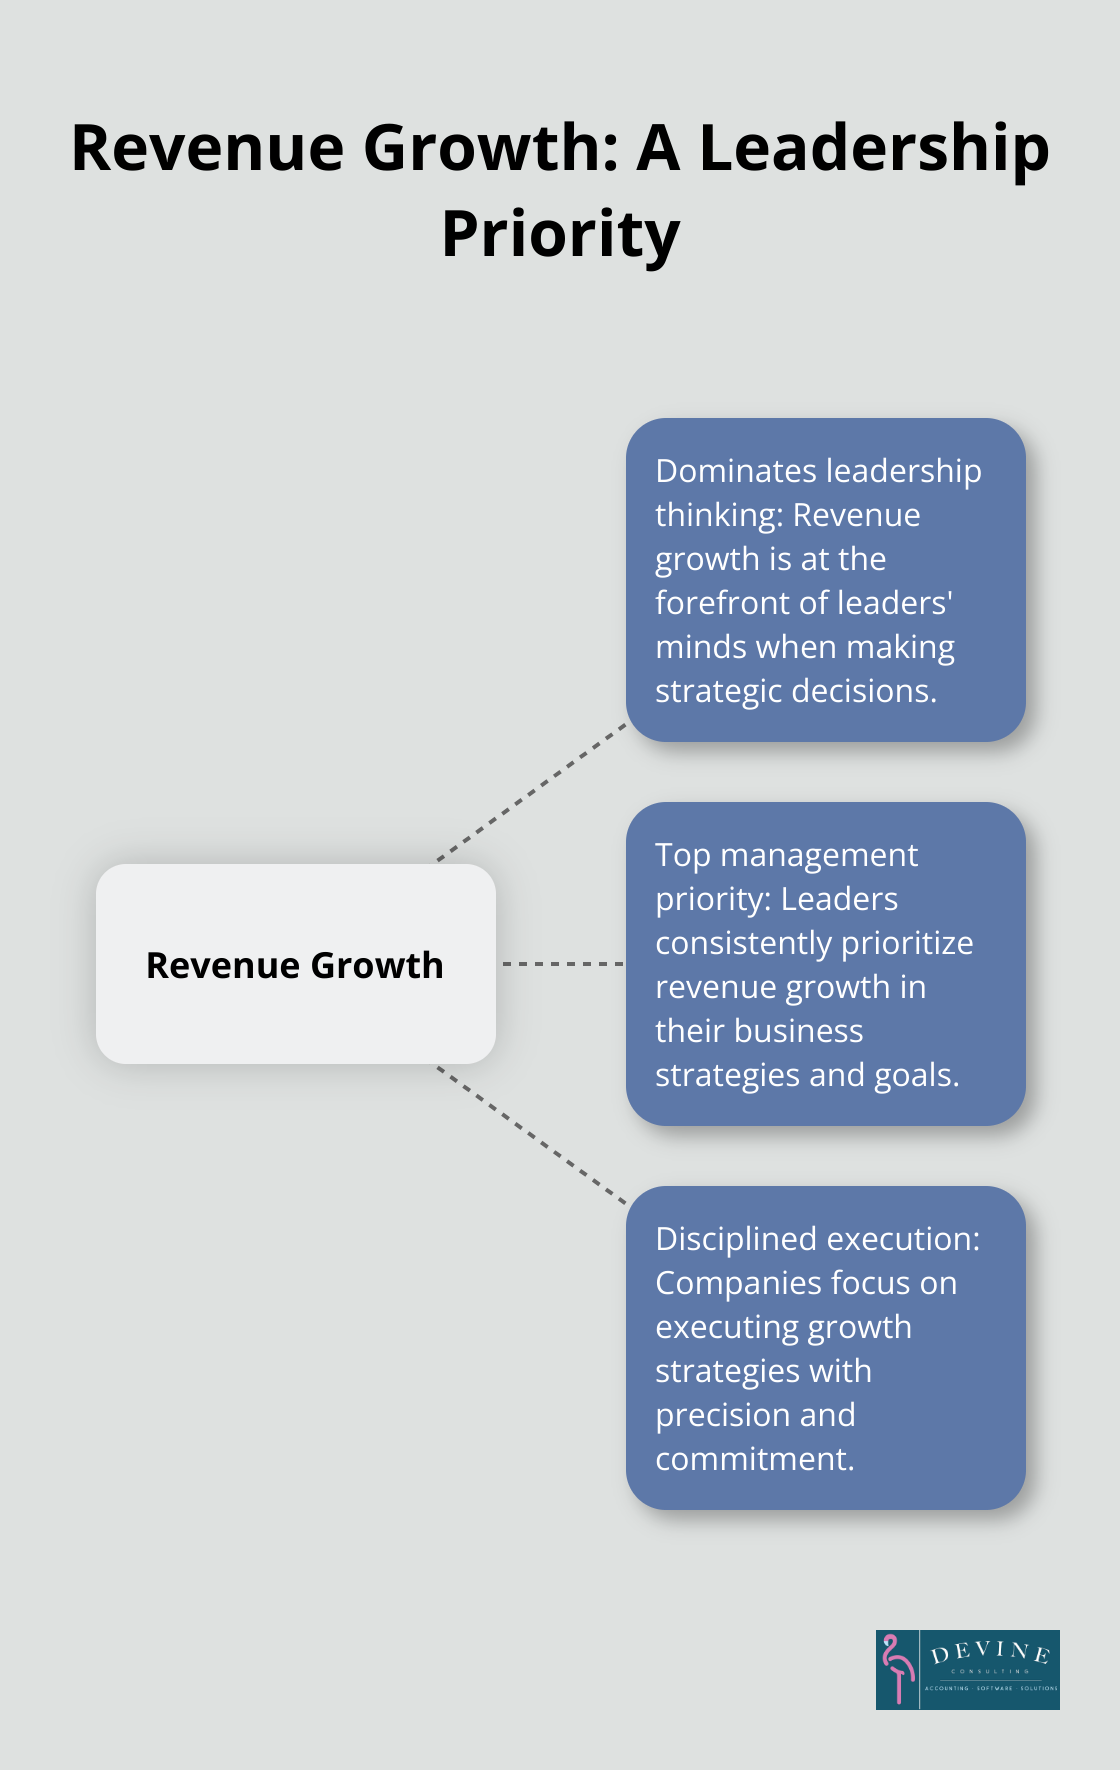
Revenue growth dominates how leaders think and the decisions they make. They manage growth as a top priority and execute with discipline. Add a ‘Strategic Implications’ section that ties financial results to the company’s overall strategy and future plans.

Investors and Shareholders
Investors primarily care about return on investment and future growth potential. Your report should emphasize profitability metrics, earnings per share (EPS), and dividend payouts (if applicable). Include industry benchmarks to provide context for your company’s performance.
Enhanced financial reporting plays a crucial role in stimulating investment. Use visual aids like charts and graphs to illustrate year-over-year growth and market position compared to competitors.
Department Managers
Departmental reports should focus on metrics directly related to the manager’s area of responsibility. For a sales department, include sales growth, customer acquisition costs, and average deal size. For operations, focus on efficiency metrics like inventory turnover and production costs.
Include a section on budget variance analysis to help managers understand how their actual spending compares to the allocated budget.
Regulatory Bodies
Reports for regulatory bodies must prioritize compliance and adhere to specific reporting standards. These reports should be detailed, accurate, and formatted according to the regulator’s requirements. For example, publicly traded companies in the U.S. must follow SEC guidelines for their financial reports.
Ensure your template includes all required disclosures and footnotes, and consider adding a compliance checklist to your report preparation process.
Now that we’ve covered how to tailor reports for different audiences, let’s move on to best practices for designing finance report templates that will make your financial data clear, engaging, and actionable.
How to Design Effective Finance Report Templates
Prioritize Clarity and Consistency
Clear and consistent formatting forms the foundation of an effective finance report template. Use a clean, professional font like Arial or Calibri, and adhere to a consistent color scheme that aligns with your brand. Maintain uniform heading styles and spacing throughout the document. This consistency helps readers navigate the report easily and focus on the content rather than deciphering the layout.
Leverage Data Visualization
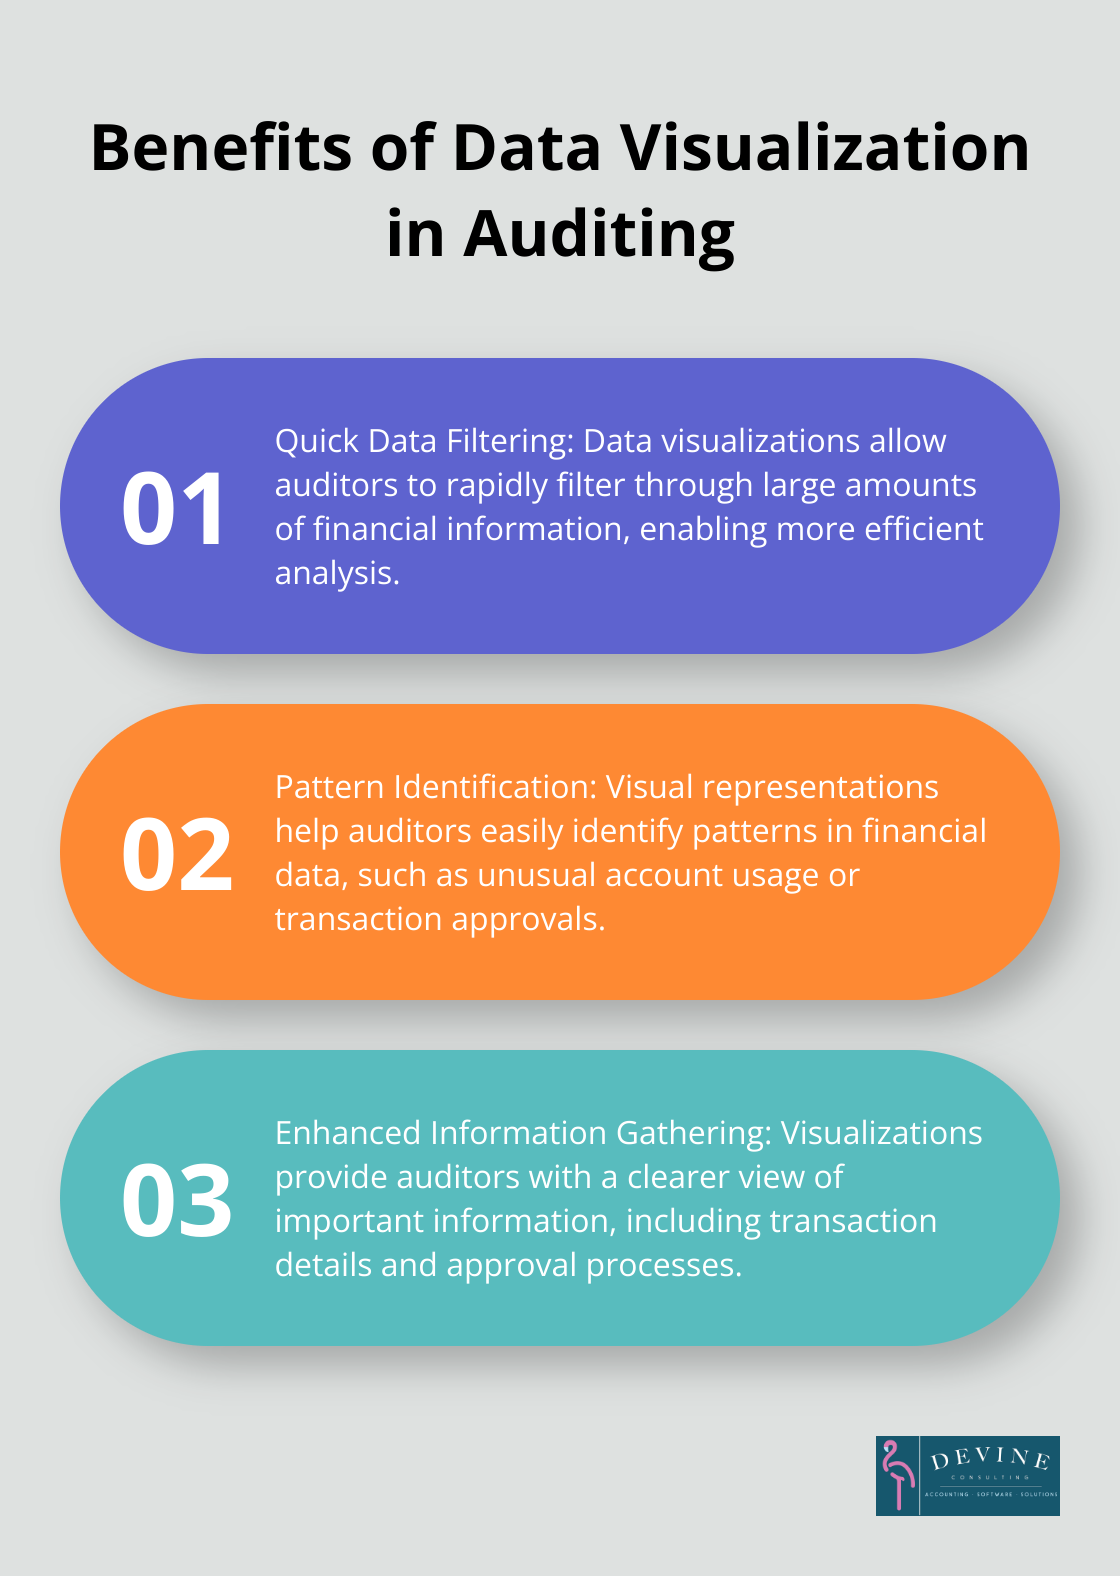
Visual elements like charts and graphs can significantly enhance the readability of your financial reports. Data visualizations enable auditors to quickly filter and compare data to identify patterns, such as which accounts were used, who created and approved transactions, and other important information.

When creating charts, select the right type for your data. Use bar charts for comparisons, line graphs for trends over time, and pie charts for showing parts of a whole. Keep your visuals simple and avoid cluttering them with unnecessary details.
Embrace Automation
Automating data input saves time and reduces errors in your financial reports. This technology allows payers to automate some processes (or parts of processes) within existing IT systems and, thus, does not require significant changes to existing infrastructure.
Consider using financial software that automatically pulls data from your accounting system into your report templates. This not only saves time but also ensures your reports always contain the most up-to-date information.
Tell a Story with Your Data
Including comparative data and trend analysis in your reports provides context and tells a story about your company’s financial performance. Show year-over-year or quarter-over-quarter comparisons to highlight growth or areas needing attention.
Provide explanations for significant changes or complex information. This context helps readers understand the implications of the data and makes your reports more valuable for decision-making.
Customize for Your Audience
Tailor your finance report templates to meet the specific needs of different stakeholders. For example, board members might require high-level strategic metrics, while department managers need detailed operational data. Try to create separate templates (or sections within a template) for each key audience to ensure the most relevant information is presented effectively.
Final Thoughts
Effective finance report templates communicate financial information clearly and efficiently. These templates include essential components such as the executive summary, income statement, balance sheet, cash flow statement, and key performance indicators. Each element presents a comprehensive picture of an organization’s financial health.
Well-designed finance report templates do more than present numbers; they tell a powerful financial story. Companies can improve decision-making processes, enhance stakeholder communication, and gain valuable insights into their financial performance through these templates. Clear formatting, visual elements, and automated data input contribute to creating reports that are informative, engaging, and easy to understand.
At Devine Consulting, we recognize the impact of well-crafted financial reports on businesses. Our accounting solutions, which include financial reporting services, help businesses across various industries achieve financial stability and growth. We encourage you to review and update your templates regularly to maintain their relevance and effectiveness, supporting informed decision-making and driving your business forward.


