How to Conduct Effective Financial Analysis

Financial analysis is the backbone of informed business decisions. At Devine Consulting, we’ve seen firsthand how mastering financial analysis methodologies can transform a company’s performance.
This blog post will guide you through the essential techniques and ratios used in financial analysis, helping you interpret results and spot critical trends. By the end, you’ll have the tools to conduct effective financial analyses that drive your business forward.
What Is Financial Analysis?
The Essence of Financial Analysis
Financial analysis transforms raw financial data into actionable insights. This process evaluates businesses, projects, budgets, and other finance-related entities to determine their performance and suitability. Companies use these insights to make informed decisions that drive their business forward.
The Foundation: Financial Statements
Financial statements form the bedrock of any robust financial analysis. Three key components provide a comprehensive view of a company’s financial health:
- Balance Sheet: This document presents a snapshot of a company’s financial position at a specific point in time. It lists assets, liabilities, and equity, which helps assess a company’s net worth and financial structure.
- Income Statement: Also known as the profit and loss statement, this document reveals revenues, expenses, and profits over a specific period. It provides essential information for evaluating profitability and operational efficiency.
- Cash Flow Statement: This statement tracks the inflows and outflows of cash. It offers insights into a company’s liquidity and its ability to generate cash (a critical factor for long-term sustainability).
Techniques for Thorough Analysis
Several techniques allow for comprehensive financial analyses:
Ratio Analysis: This method calculates financial ratios from data in financial statements. For example, the current ratio (current assets divided by current liabilities) helps assess a company’s short-term liquidity.

Trend Analysis: This technique compares financial data over time to identify patterns and predict future performance. For instance, a steadily declining gross profit margin over five years might indicate pricing pressures or rising costs.
Comparative Analysis: This approach benchmarks a company’s financial performance against industry peers or competitors. It helps identify areas where a business outperforms or underperforms relative to its industry.
The Impact of Financial Analysis
Effective financial analysis reveals critical insights about a business. Allocation of costs to activities provides a missing link between the activities a business performs and the subsequent impact on customer, product and channel.
Financial analysis benefits businesses of all sizes. According to an Intuit survey, 65% of small business owners who conduct regular financial analyses report feeling more confident about their business decisions.
Companies across various industries have used financial analysis to transform their operations. For example, construction industry businesses have improved project cost management through financial analysis, resulting in significant profit margin increases.
The next section will explore specific financial ratios and metrics that provide valuable insights into your business’s financial health. These tools will help you conduct more effective financial analyses and make data-driven decisions for your company’s future.
Financial Ratios That Drive Business Decisions
Financial ratios serve as powerful tools for assessing a company’s health. These ratios help business owners and managers assess the company’s financial health, including liquidity, profitability, leverage, and efficiency. Let’s explore the most important ratios and their benefits for your business.
Liquidity Ratios: Assessing Short-Term Financial Health
The current ratio is a liquidity ratio that measures a company’s ability to pay short-term obligations or those due within one year. The current ratio (current assets divided by current liabilities) should ideally exceed 1, showing that a company can cover its short-term obligations. However, a ratio significantly above 1 might indicate inefficient asset use.
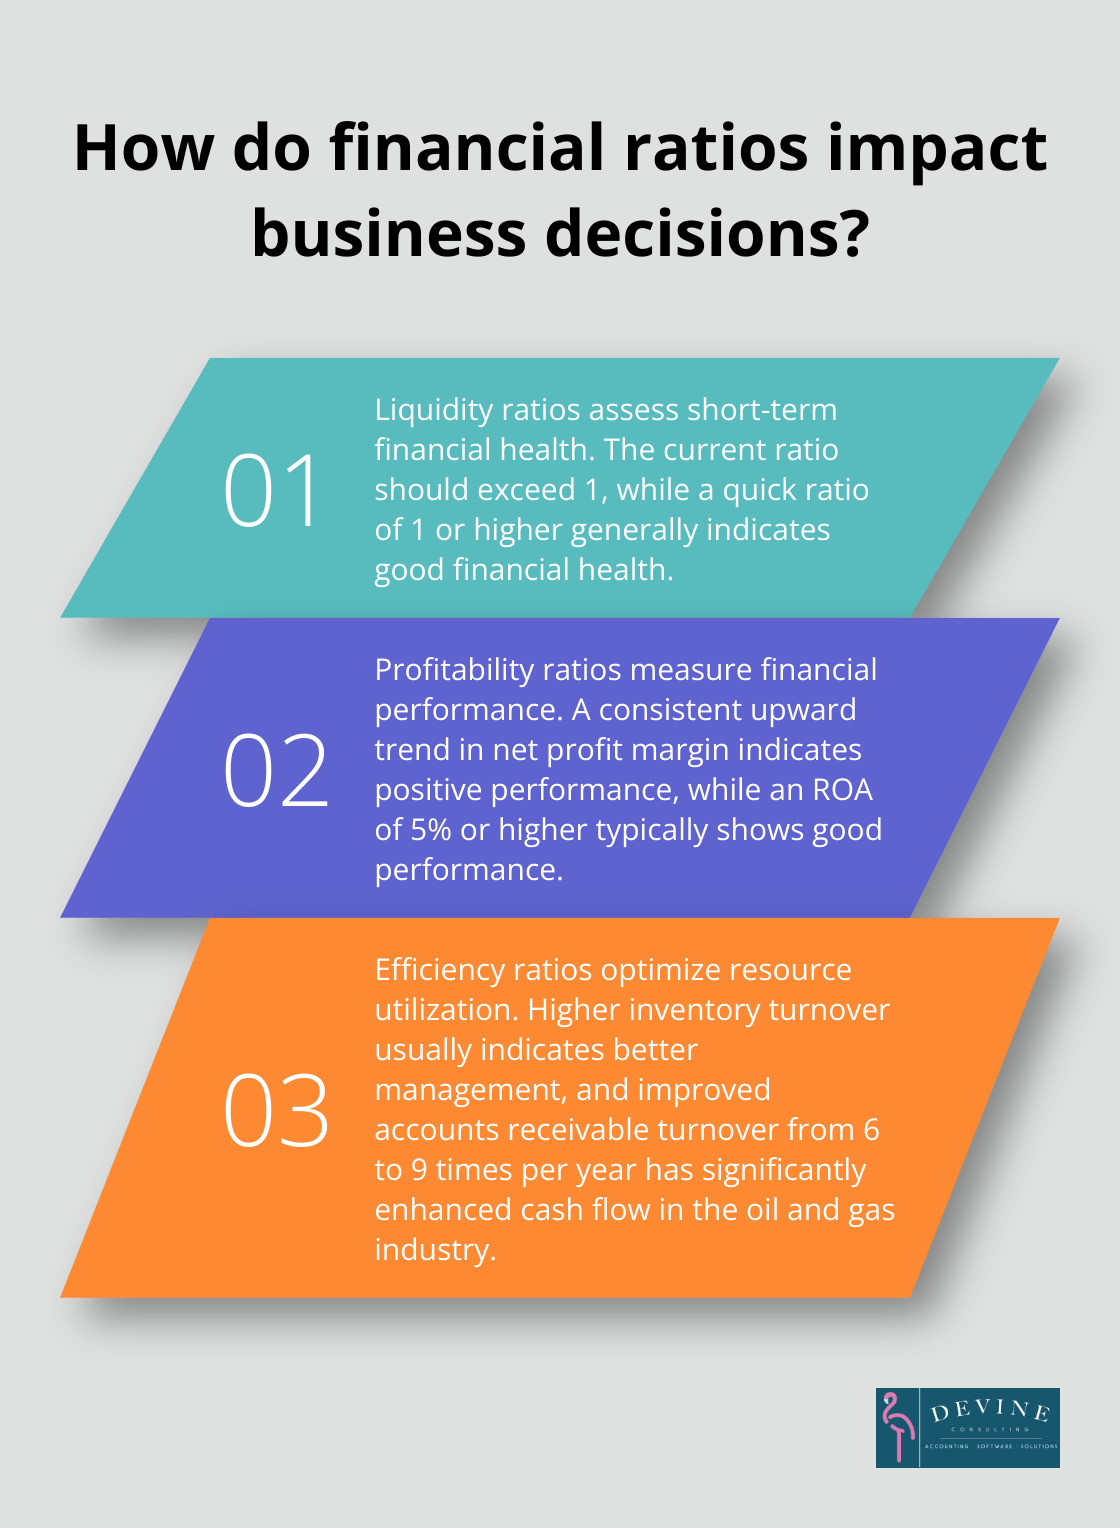
The quick ratio, also known as the acid-test ratio, provides a clearer picture of immediate liquidity by excluding inventory from current assets. A quick ratio of 1 or higher generally indicates good financial health, but this can vary by industry.
In the construction industry, lower quick ratios often occur due to high inventory levels. A construction company with a quick ratio of 0.8 might still maintain good financial health, while a software company with the same ratio could face liquidity issues.
Profitability Ratios: Measuring Financial Performance
Gross profit margin, net profit margin, and return on assets (ROA) serve as key profitability indicators. Gross profit margin shows the percentage of revenue retained after accounting for the cost of goods sold. A higher gross margin indicates better efficiency in turning raw materials into income.
Net profit margin reveals the percentage of revenue that becomes profit after deducting all expenses. This ratio varies widely across industries, but a consistent upward trend generally indicates positive performance.
ROA measures how efficiently a company uses its assets to generate profit. An ROA of 5% or higher typically indicates good performance, but this varies by industry. Real estate companies often have lower ROAs due to their asset-heavy nature.
Efficiency Ratios: Optimizing Resource Utilization
Inventory turnover and accounts receivable turnover ratios help assess a company’s efficiency. Inventory turnover shows how quickly a company sells its inventory. A higher ratio usually indicates better inventory management, but an extremely high ratio might suggest stockouts.
Accounts receivable turnover measures how quickly a company collects payments from customers. A higher ratio generally indicates efficient collection practices. However, if it’s too high, it might suggest overly strict credit policies that could hamper sales.
In the oil and gas industry, companies have improved their accounts receivable turnover from 6 to 9 times per year by implementing better collection strategies, significantly improving their cash flow.
Solvency Ratios: Evaluating Long-Term Financial Stability
The debt-to-equity ratio and interest coverage ratio serve as key solvency indicators. The debt-to-equity ratio shows the proportion of company financing that comes from debt versus equity. A lower ratio generally indicates less risk, but some debt can benefit growth and tax purposes.
The interest coverage ratio measures how easily a company can pay interest on its debt. A ratio below 1.5 often indicates risk, while above 3 generally indicates safety. However, in capital-intensive industries like real estate, lower ratios might prove acceptable due to stable cash flows.
Financial ratios provide valuable insights, but interpreting these ratios requires careful consideration of industry norms and company-specific factors. The next section will explore how to effectively interpret financial analysis results and use them to inform strategic decision-making.
How to Extract Meaningful Insights from Financial Data
Identify Trends and Patterns
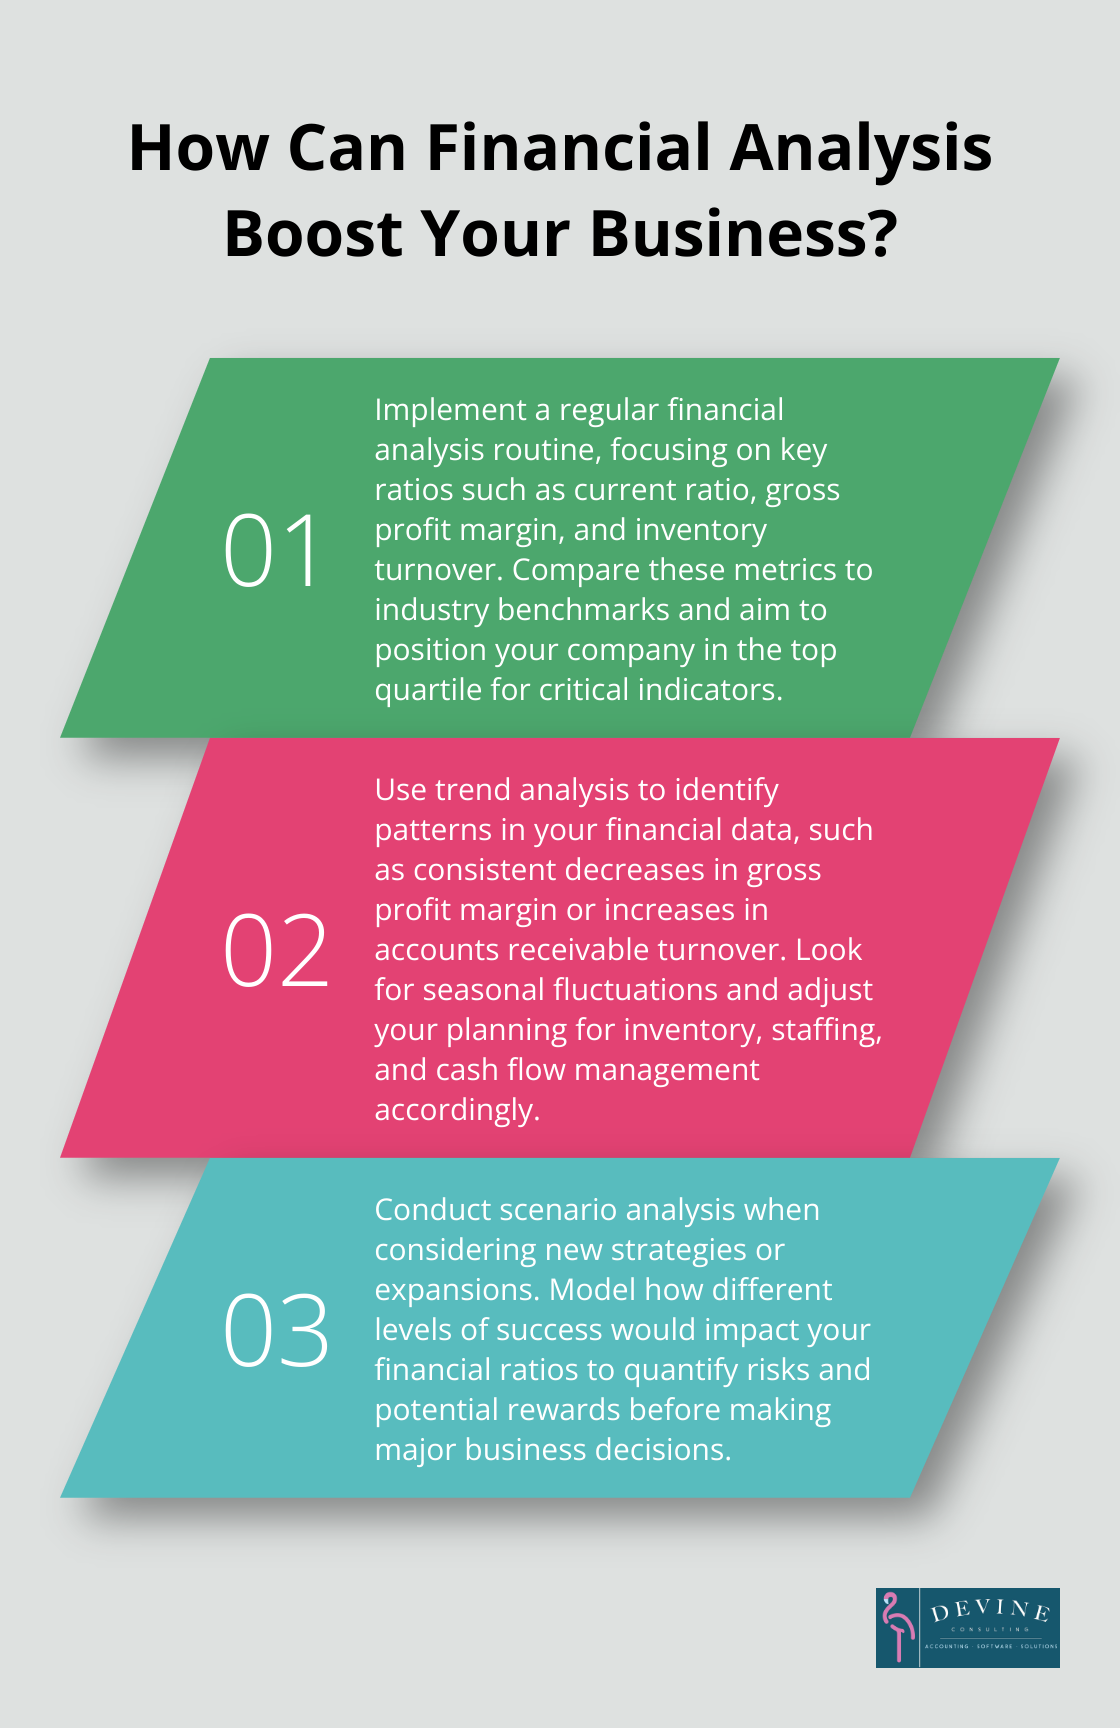
Financial analysis requires a focus beyond individual data points to recognize overarching trends. A decrease in gross profit margin by 2% annually for three consecutive years suggests rising costs or pricing pressures that require attention. An upward trend in accounts receivable turnover ratio might indicate improving collection practices.
Seasonal patterns play a significant role in financial analysis. Retail businesses often experience sales spikes during holiday seasons, while construction companies might face slowdowns during winter months. Recognition of these patterns aids in planning inventory, staffing, and cash flow management.
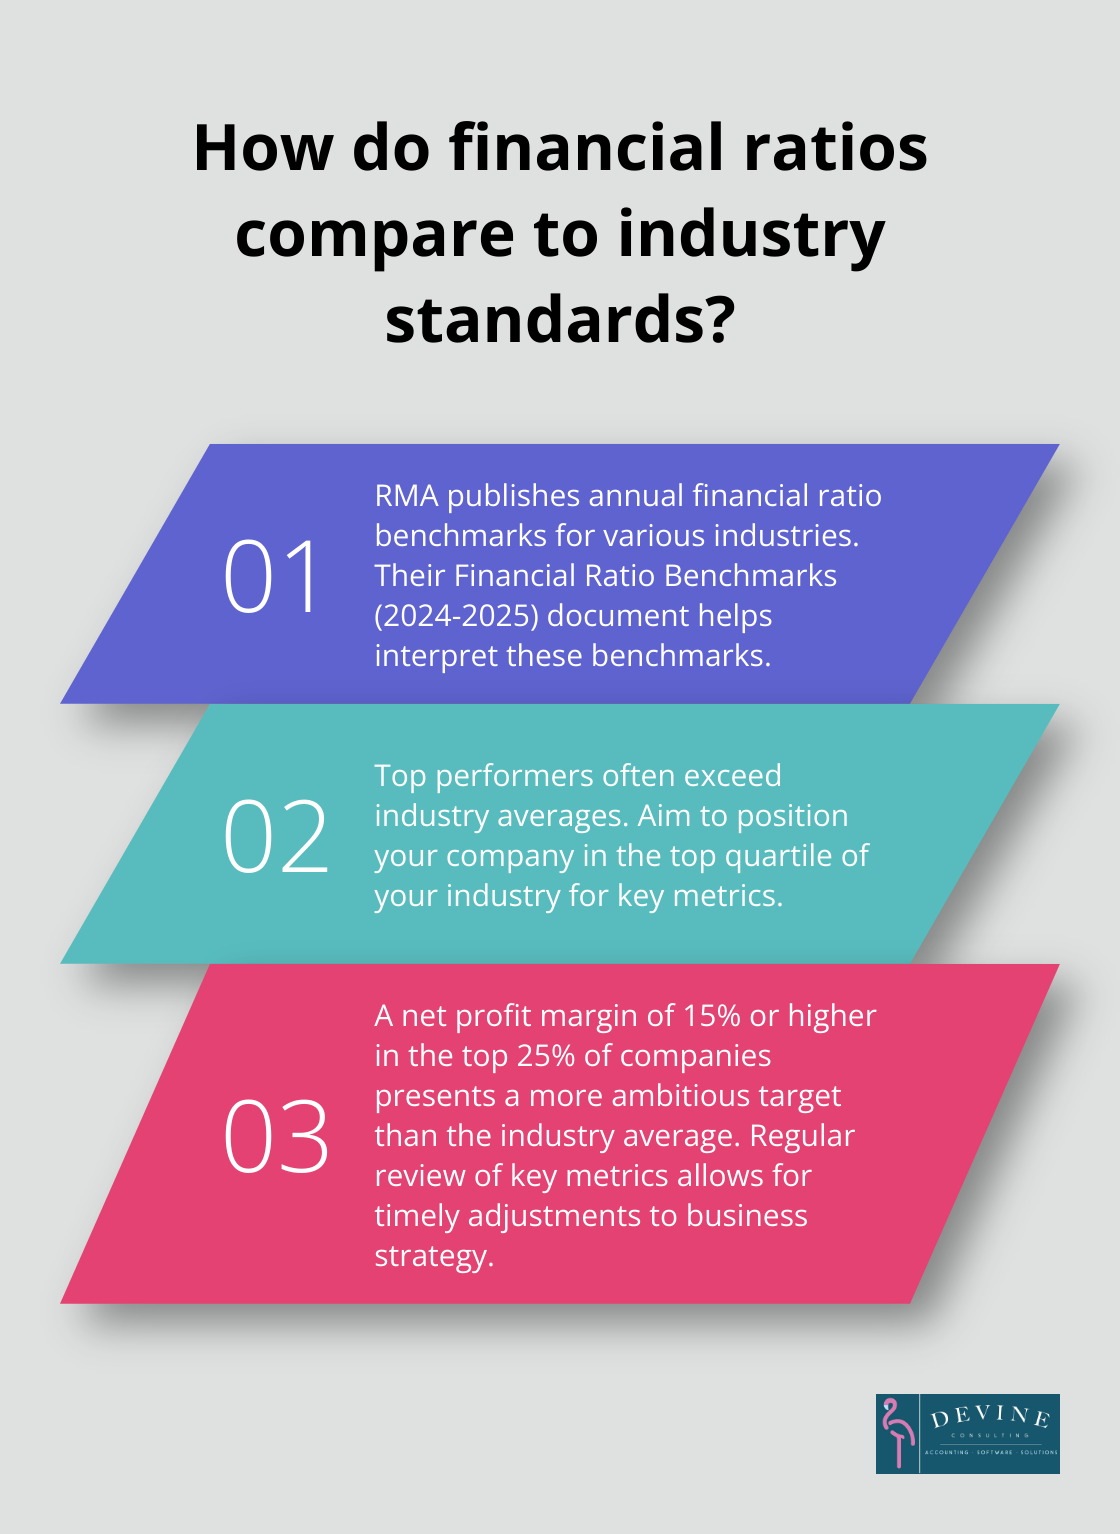
Compare to Industry Standards
Comparison of financial ratios to industry averages provides context for performance evaluation. The Risk Management Association (RMA) publishes annual financial ratio benchmarks for various industries. Their Financial Ratio Benchmarks (2024-2025) document helps understand and interpret these benchmarks.
However, industry averages should not be the sole target. Top performers often exceed these benchmarks. Try to position your company in the top quartile of your industry for key metrics. If the top 25% of companies in your industry have a net profit margin of 15% or higher, this presents a more ambitious (and potentially rewarding) target than the industry average.
Identify Warning Signs
Certain financial indicators serve as early warning signs of potential problems. A consistently declining current ratio might signal impending liquidity issues. If your debt-to-equity ratio rises faster than your industry peers, it could indicate over-leveraging.
Pay attention to discrepancies between profit and cash flow. A company can show profits on paper but still face cash flow problems. If net income consistently exceeds operating cash flow, it might indicate issues with collecting payments or managing inventory.
Use Analysis to Drive Strategy
Financial analysis should inform action. If your inventory turnover ratio falls below industry standards, consider implementation of just-in-time inventory management. If your gross profit margin declines, investigate ways to reduce costs or adjust pricing strategies.
Use scenario analysis to test potential strategies. For example, if you consider expansion into a new market, model how different levels of success would impact your financial ratios. This approach helps quantify risks and potential rewards.
Financial analysis requires an ongoing process. Regular review of key metrics allows for timely adjustments to business strategy. Consistent application of these interpretation techniques equips you to make data-driven decisions that propel your business forward. Client Advisory Services can provide advanced data analytics techniques to deliver optimal business outcomes, going beyond basic reporting.
Final Thoughts
Financial analysis methodologies form the cornerstone of informed business decision-making. Companies gain invaluable insights into their financial health, operational efficiency, and competitive positioning through these techniques. Regular financial analysis allows businesses to spot trends, identify potential issues, and capitalize on growth opportunities.
The power of financial analysis transforms raw data into actionable insights. Ratio analysis, trend analysis, and comparative analysis help businesses evaluate their liquidity, profitability, efficiency, and solvency. These metrics provide a comprehensive view of a company’s financial performance and guide strategic decisions.
We at Devine Consulting understand the complexities of financial analysis across various industries. Our comprehensive accounting solutions help businesses navigate their financial landscape (from accurate bookkeeping to strategic financial planning). You can focus on your core operations while ensuring your financial analysis practices drive growth and stability with expert support.