How to Create an Effective Finance Report PDF

At Devine Consulting, we know that creating a finance report PDF is a critical skill for any business professional. Clear financial reporting is the backbone of informed decision-making and strategic planning.
In this post, we’ll guide you through the process of crafting an effective finance report PDF that communicates your financial data with clarity and impact. We’ll cover everything from data collection to design and formatting, ensuring your reports are both informative and visually appealing.
How to Gather and Organize Financial Data
Identify Key Financial Metrics
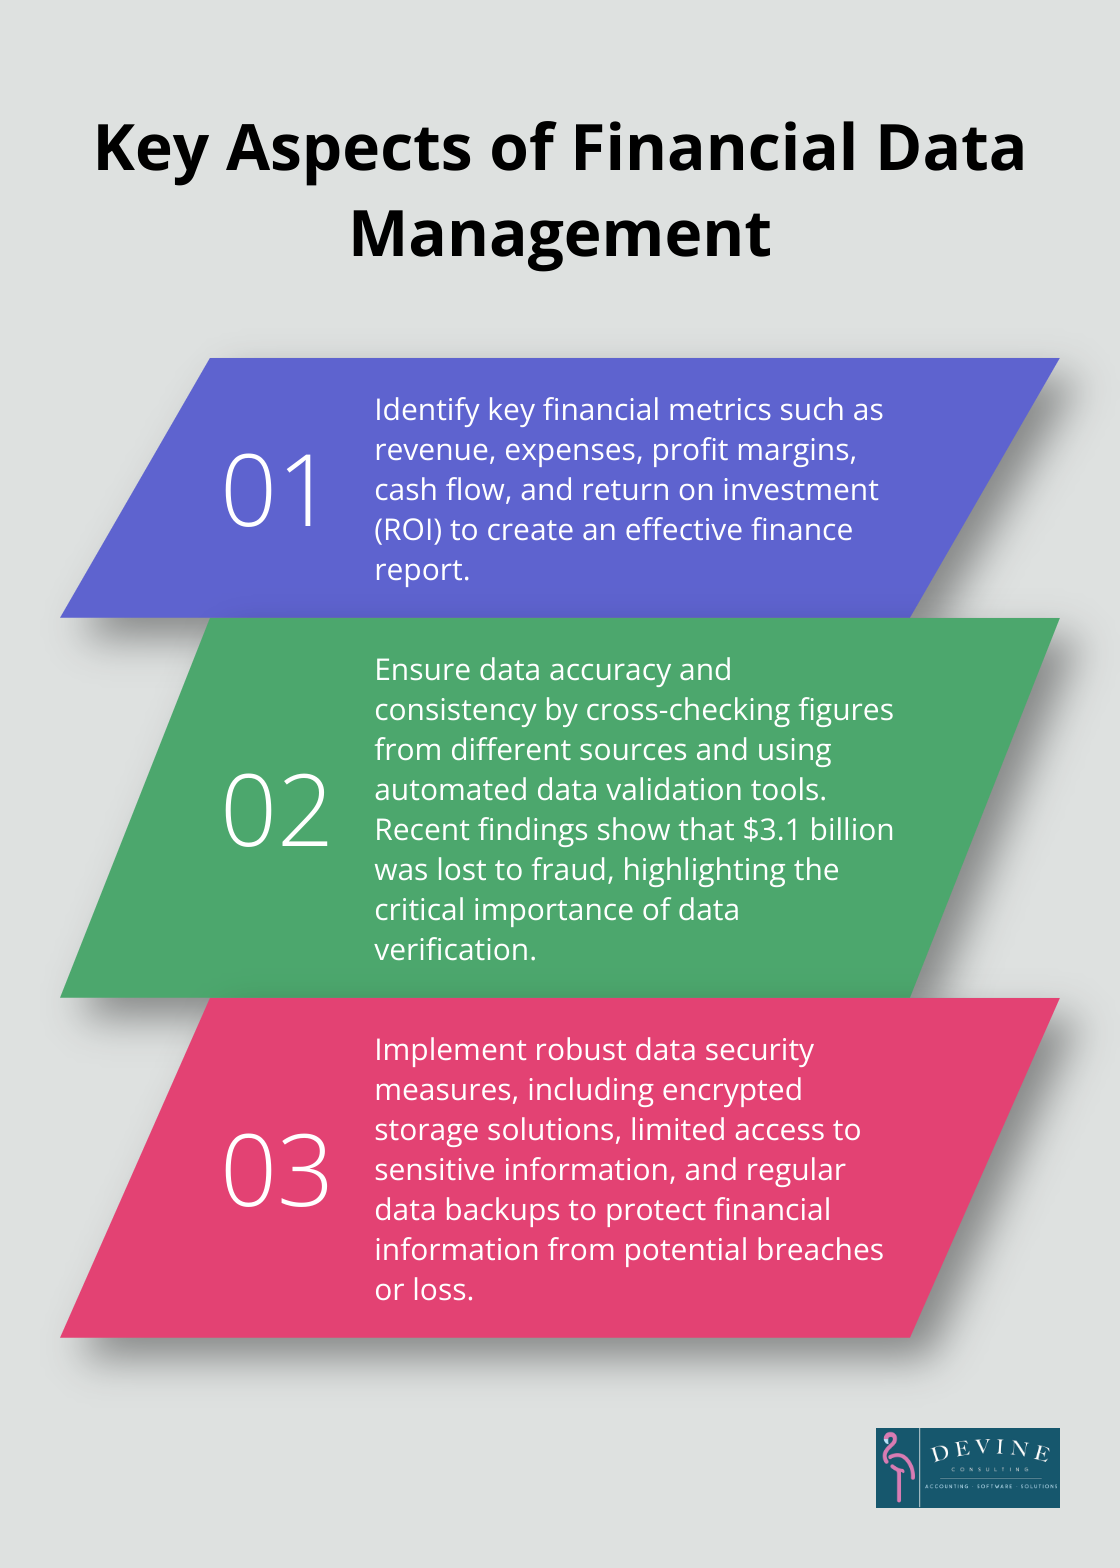
The first step in creating an effective finance report PDF is to pinpoint the most relevant financial metrics for your business. These typically include revenue, expenses, profit margins, cash flow, and return on investment (ROI). AI-generated summaries of customer payment patterns might signal the need for crucial cash flow management refinements, as more CFOs are making tangible progress in this area.
Collect Data from Multiple Sources
After identifying key metrics, collect data from various sources. This includes your accounting software, bank statements, credit card statements, invoices, and expense reports. Don’t overlook less obvious sources like customer relationship management (CRM) systems or project management tools, which can provide valuable financial insights.
Ensure Data Accuracy and Consistency
Data accuracy is paramount. Cross-check figures from different sources to spot discrepancies. Use automated data validation tools to catch errors. Recent findings show that $3.1 billion was lost to fraud, highlighting the importance of data verification.
Standardize Data Formats
When organizing your data, use a standardized format across all sources. This consistency makes it easier to compare and analyze information. Consider using data visualization tools to spot trends and anomalies quickly.
Implement Data Security Measures
As you gather and organize financial data, it’s essential to implement robust security measures. This includes using encrypted storage solutions, limiting access to sensitive information, and regularly backing up your data. (These precautions will help protect your financial information from potential breaches or loss.)
The quality of your finance report depends on the quality of your data. Meticulous gathering and organization of financial information sets the stage for a report that provides genuine value to your organization. Now that we’ve covered data collection and organization, let’s move on to designing an effective layout for your finance report PDF.
How to Design an Effective Finance Report Layout
Select the Appropriate Reporting Period
The foundation of an effective finance report layout starts with choosing the right reporting period. Monthly reports excel at tracking short-term trends and facilitating quick operational adjustments. Quarterly reports offer a broader perspective, ideal for assessing progress towards annual goals. Annual reports provide a comprehensive overview of financial performance and often fulfill regulatory requirements.
Most businesses benefit from a combination of monthly and quarterly reports, supplemented by an annual summary. This approach enables timely decision-making while maintaining a long-term perspective.
Structure Your Report for Clarity
Begin your report with an executive summary that spotlights key findings and recommendations. Limit this section to one page to capture the reader’s attention immediately.
Follow the executive summary with detailed sections on revenue, expenses, cash flow, and profitability. Prioritize these sections based on their relevance to your specific business objectives. (For instance, if cash flow is a top concern, position that section early in the report.)
Utilize Visual Elements Effectively
Incorporate charts, graphs, and tables throughout your report to enhance clarity. Use bar charts to compare revenue across different periods, pie charts to break down expenses by category, and line graphs to illustrate trends over time.
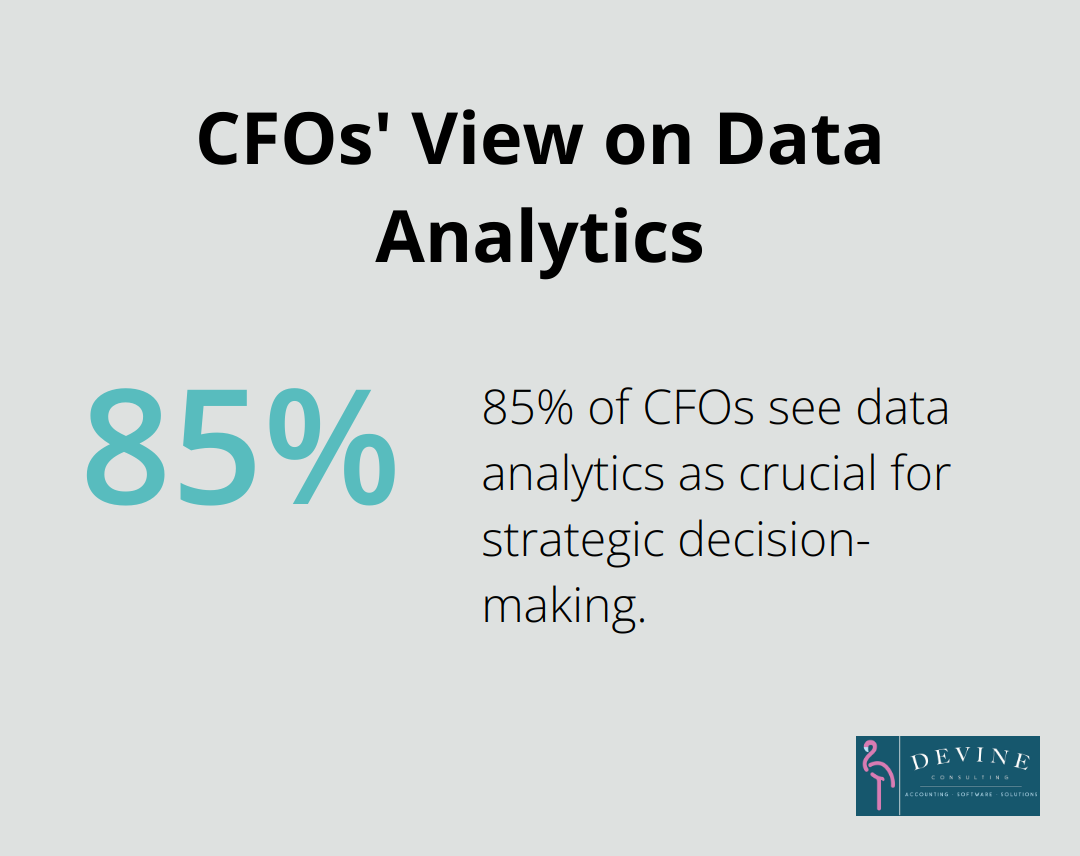
A study by the Financial Executives Research Foundation revealed that 85% of CFOs see data analytics as crucial for strategic decision-making. This underscores the importance of visual elements in financial reporting.
Maintain consistency in your visuals by using the same color scheme and style throughout the report. Limit your color palette to 3-4 colors to avoid overwhelming the reader.
Optimize for Scannability
Create a report that’s easy to scan in today’s fast-paced business environment. Use clear, descriptive headings and subheadings to guide readers through the document. Consider including a table of contents for longer reports.
Embrace white space as your ally. Avoid cramming too much information onto a single page. Instead, use ample margins and spacing to enhance readability.
The next chapter will explore how to write and format your finance report effectively, ensuring that your well-designed layout is complemented by clear, concise content.
How to Write a Clear Finance Report
Craft a Compelling Executive Summary
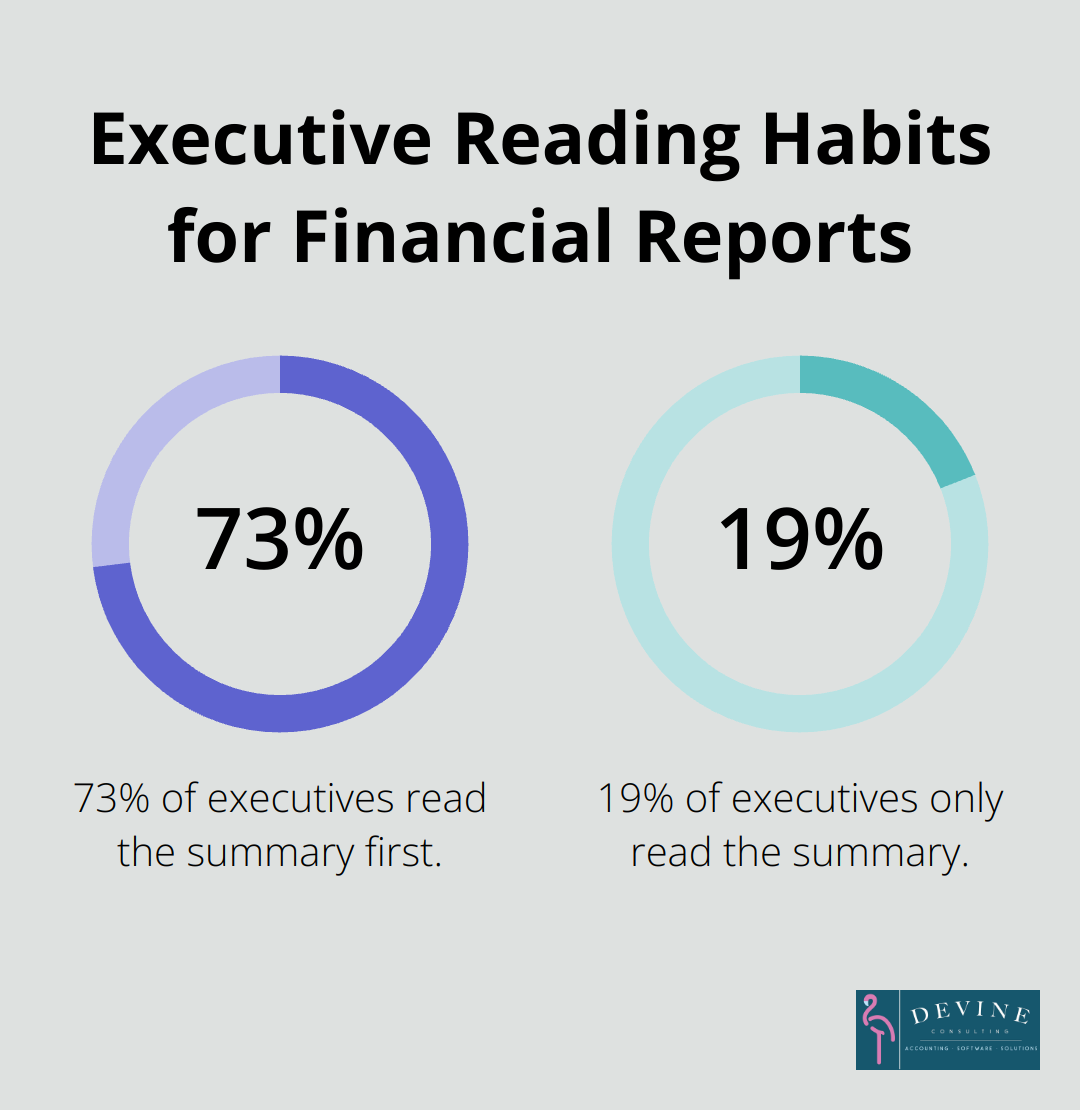
Start your finance report with a powerful executive summary. This section should provide a concise overview of key findings and recommendations. Try to limit it to 500 words. A study by the Financial Executives Research Foundation reveals that 73% of executives read the summary first, while 19% only read the summary. (This underscores the importance of a well-crafted executive summary.)
Use Plain Language
When writing the main body of your report, prioritize clarity. Avoid jargon and complex financial terms where possible. If technical terms are necessary, provide clear definitions. The Plain Language Association International aims to help people understand and use plain-language principles.
Structure Your Report Logically
Organize your report in a logical manner. Begin with an overview of your financial position, then move into specific areas such as revenue, expenses, and cash flow. Use subheadings to break up text and guide readers through your report.
Provide Impactful Analysis
Your analysis should offer more than just numbers. Explain the significance of the figures for your business. For example, instead of simply reporting a 5% increase in revenue, discuss the factors that drove this growth and its implications for future performance.
Include comparative data where relevant. Compare current performance to previous periods or benchmark against industry standards. The Hackett Group suggests that benchmarking in business helps improve performance, drive growth, and stay ahead of the competition with effective strategies.
Format for Readability
The visual presentation of your report plays a critical role in its effectiveness. Use a clean, professional font like Arial or Calibri, and stick to a font size of 11 or 12 for body text. Larger fonts (14-16) work well for headings.
Maintain consistency in formatting. Use the same style for all headings, keep consistent spacing between sections, and align your text and numbers properly. This attention to detail enhances the professional look of your report and improves readability.
Use color sparingly as a powerful tool. Choose a color scheme that aligns with your brand and apply it consistently throughout your report. Limit yourself to 2-3 colors to avoid visual overload.
Final Thoughts
Creating an effective finance report PDF transforms decision-making processes and propels organizations forward. A well-crafted financial report provides clarity, insights, and direction, serving as a strategic asset for businesses. We at Devine Consulting have witnessed how these reports form the foundation for informed discussions, strategic planning, and improved business outcomes.
The process of creating finance report PDFs requires attention to detail, from gathering precise data to designing intuitive layouts and writing clear content. Regular review and refinement of the reporting process ensure that financial reports evolve with the changing needs of the business. This approach turns financial reporting from a mere obligation into a valuable resource that guides organizations towards their goals.
For expert guidance in financial reporting and management, Devine Consulting offers comprehensive accounting solutions tailored to various industries. Our team can help streamline financial processes (ensuring you have the insights needed to make informed decisions and drive growth). The ability to create and interpret finance report PDFs provides a competitive advantage in today’s data-driven business landscape.