How to Create an Effective Finance Report Sample

Creating a finance report sample can be daunting, but it’s a vital skill for any business professional. At Devine Consulting, we’ve seen how well-crafted financial reports can drive better decision-making and boost investor confidence.
This guide will walk you through the key components of an effective finance report, provide tips on structuring your data, and offer insights on presenting your financial information clearly and compellingly.
Key Components of an Effective Finance Report
An effective finance report forms the foundation of sound financial decision-making. Five critical components should be included in every finance report to provide a comprehensive view of a company’s financial health.
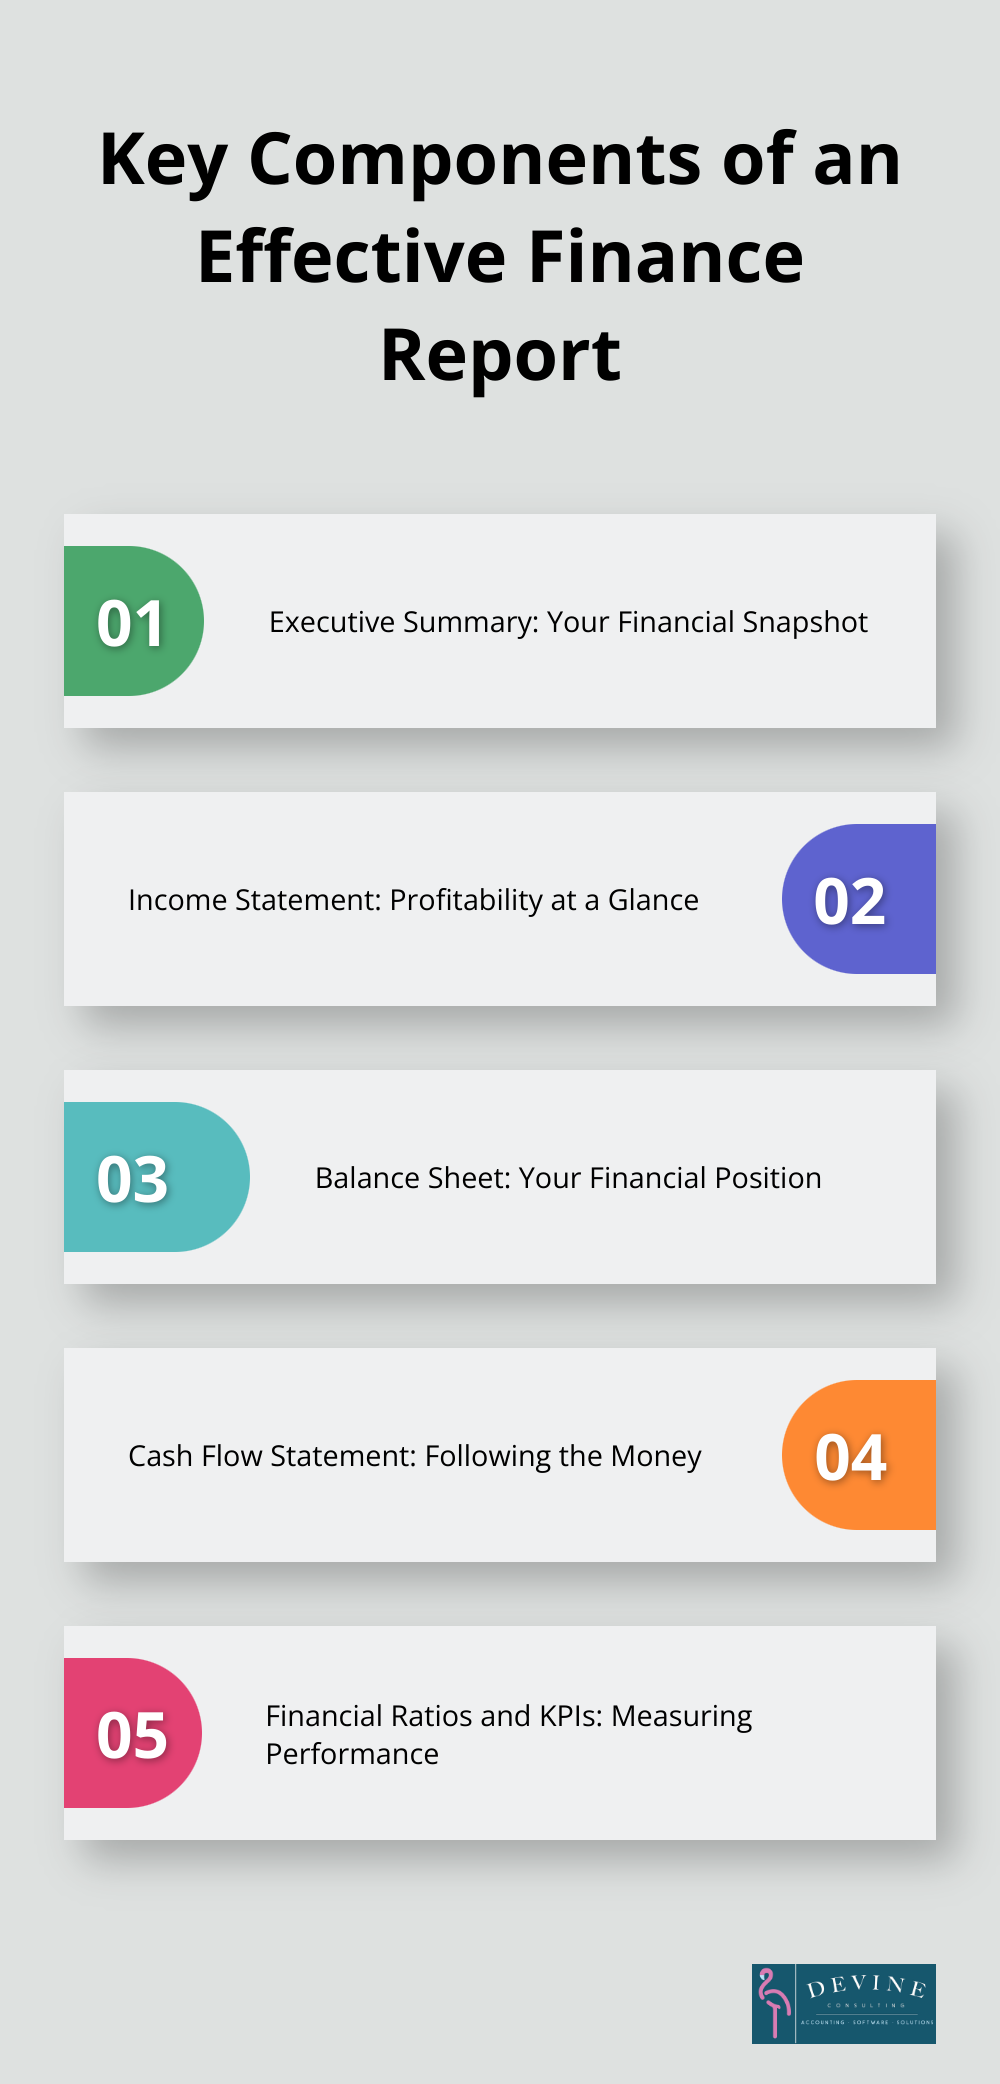
Executive Summary: Your Financial Snapshot
The executive summary acts as your report’s opening act. This concise overview of your company’s financial performance (typically no longer than a page) should highlight key financial metrics, significant changes from previous periods, and any critical issues or opportunities. You might note a 15% increase in revenue or a successful cost-cutting initiative that boosted profit margins by 5%.
Income Statement: Profitability at a Glance
The income statement is a financial report used by a business. It tracks the company’s revenue, expenses, gains, and losses during a set period. This section should clearly break down different revenue streams and expense categories. A software company might separate subscription revenue from one-time license fees. On the expense side, you should distinguish between direct costs (like server expenses) and indirect costs (like marketing spend).
Balance Sheet: Your Financial Position
The balance sheet provides a snapshot of your company’s assets, liabilities, and equity at a specific point in time. It’s essential for assessing your company’s financial stability and liquidity. When presenting your balance sheet, group similar items together for clarity. Separate current assets (like cash and accounts receivable) from long-term assets (like property and equipment). This organization helps readers quickly gauge your company’s short-term financial health.

Cash Flow Statement: Following the Money
The cash flow statement tracks the inflows and outflows of cash in your business. It’s divided into three sections: operating activities, investing activities, and financing activities. This statement is vital for understanding your company’s liquidity and ability to generate cash. A positive cash flow from operations coupled with negative cash flows from investing could indicate a company that’s reinvesting its profits for growth.
Financial Ratios and KPIs: Measuring Performance
Financial ratios and KPIs provide context to your financial data. They allow for easy comparison with industry benchmarks and your company’s historical performance. Examples of profitability KPIs include gross and net margin and earnings per share (EPS). Efficiency KPIs include the payroll headcount ratio.
These five key components provide a comprehensive view of your company’s financial health. The next section will explore how to structure this information for maximum clarity and impact.
How to Structure Your Finance Report for Maximum Impact
At Devine Consulting, we’ve refined our approach to create reports that are both informative and user-friendly. Here’s how you can structure your finance report for maximum impact:
Establish a Clear Hierarchy
Start your report with the most critical information. Place your executive summary at the forefront, followed by key financial statements in order of importance. This hierarchy ensures that readers can quickly grasp the most crucial data points without having to search through the entire report.
Strategically Use Visual Elements
Incorporate charts, graphs, and tables to break up text and illustrate key points. A line graph can effectively show revenue trends over time, while a pie chart can display expense breakdowns. Studies show that visuals increase information retention by up to 65%. The human brain processes images 60,000 times faster than text, making visualization a powerful tool for conveying financial data.
Maintain Consistent Formatting
Consistency in formatting is essential to a professional-looking report. Use the same font, color scheme, and layout throughout the document. This approach not only looks more polished but also helps readers navigate the report more easily. (For instance, always use the same shade of blue for positive trends and red for negative ones across all charts and graphs.)
Provide Context with Footnotes and Explanations
Don’t assume your readers will understand every number or term. Include footnotes or brief explanations for complex financial concepts or unusual line items. This strategy ensures that your report is accessible to a wider audience, including non-financial stakeholders who may be key decision-makers.
Implement Clear Labeling and Headings
Use clear, descriptive headings and subheadings to guide readers through your report. This approach helps readers quickly locate specific information and understand the overall structure of the report. Label all charts, tables, and graphs clearly to avoid confusion and enhance comprehension. Consider creating a coding structure that aligns with your work breakdown structure to further organize your financial data.
The next section will explore effective techniques for data presentation and analysis, building on these structural principles to create a truly impactful finance report.
How to Present Financial Data Effectively
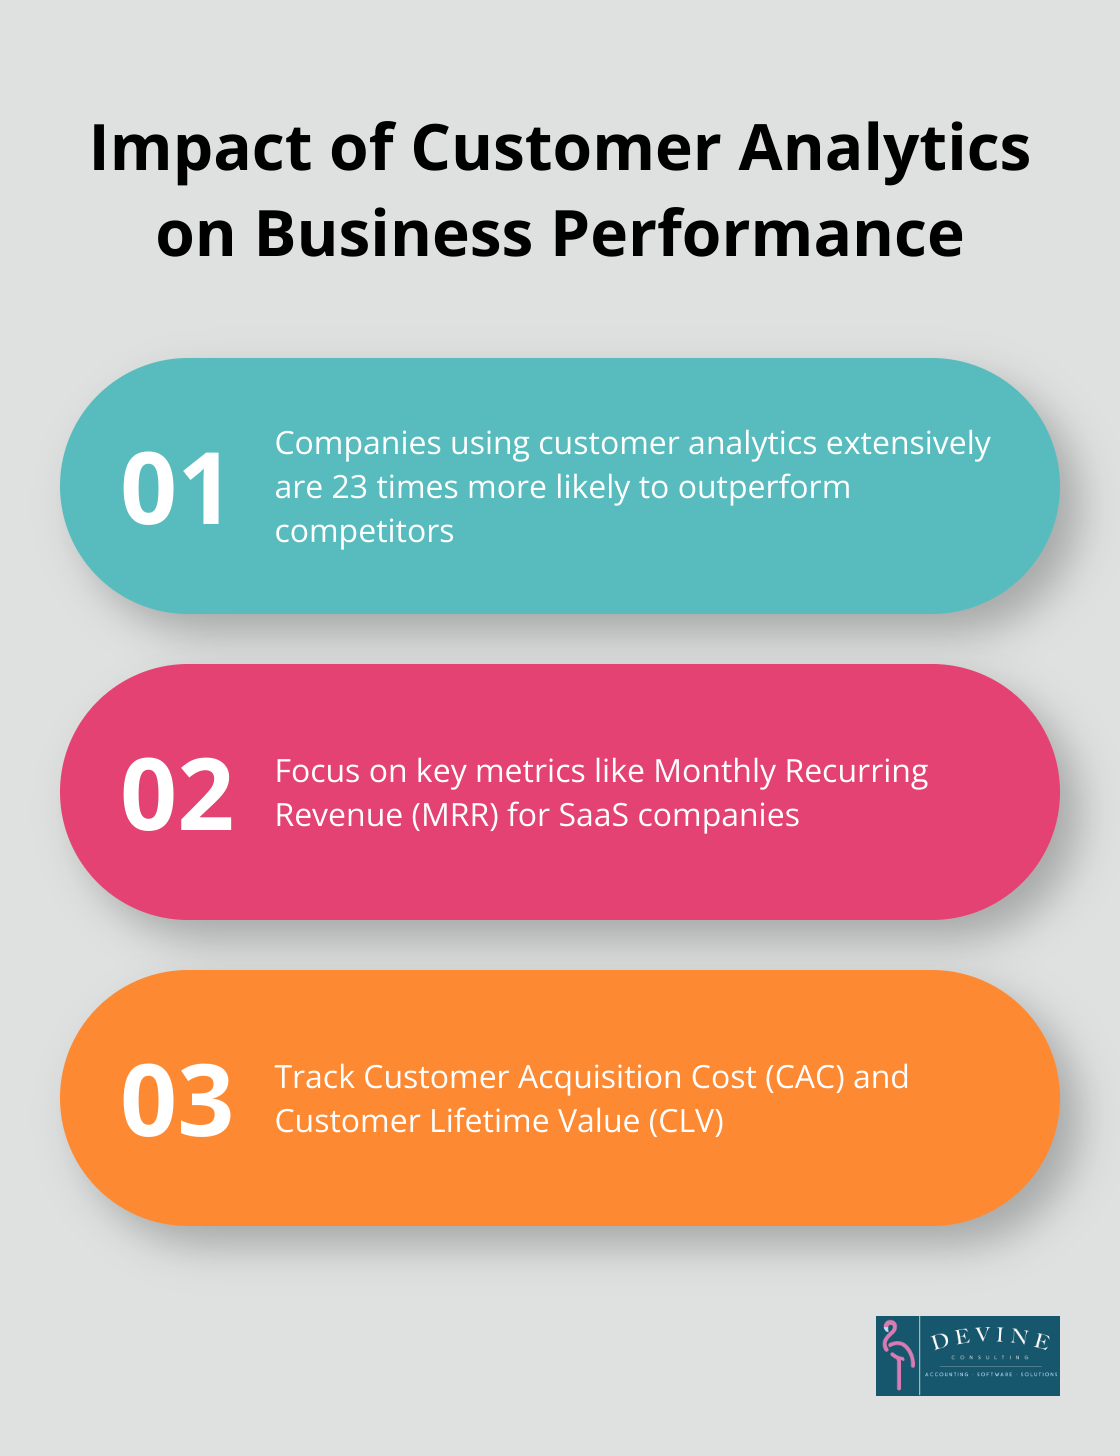
Focus on Key Performance Indicators
When you present financial data, select the metrics that matter most to your business. For a SaaS company, this might include Monthly Recurring Revenue (MRR), Customer Acquisition Cost (CAC), and Customer Lifetime Value (CLV). A study by McKinsey found that companies which use customer analytics extensively are 23 times more likely to outperform their competitors in new customer acquisition.
Choose 5-7 KPIs that provide the most insight into your company’s financial health and performance. This focused approach allows stakeholders to quickly grasp the most important aspects of your financial situation.
Provide Context Through Benchmarking
Numbers in isolation often lack meaning. To make your financial data more impactful, always provide context through benchmarking. Compare your current performance to previous periods, industry standards, or competitors.
For example, if your gross margin is 30%, that number alone doesn’t tell the full story. However, if you show that it’s increased from 25% last year and the industry average is 28%, you’ve provided valuable context that highlights your company’s improving efficiency and competitive position.
Visualize Data for Quick Understanding
The claim that humans process visual information 60,000 times faster than text is a myth. Use charts, graphs, and infographics to present your financial data, but be aware that this statistic is not supported by evidence.
For trend analysis, line charts are particularly effective. Bar charts work well for comparing different categories, while pie charts can illustrate the composition of a whole. Heat maps can show the performance of different business units or products at a glance.
Keep your visuals clean and simple. Avoid cluttering charts with unnecessary information or using 3D effects that can distort data perception.
Tailor Reports to Your Audience
Different stakeholders have different information needs. Customize your financial reports to address these specific needs. For example:
- Executives might want high-level KPIs and strategic insights.
- Managers might need more detailed operational metrics.
- Investors might focus on growth rates and profitability indicators.
Try to create different versions of your report for different audiences (this approach ensures that each stakeholder group receives the most relevant information).
Use Clear and Concise Language
Financial reports often contain complex information. Use clear, concise language to make your reports more accessible. Avoid jargon where possible, and when you must use technical terms, provide brief explanations.
Break down complex ideas into smaller, more digestible parts. Use bullet points and short paragraphs to improve readability. This approach helps ensure that your financial data is understood and acted upon by all stakeholders.
Final Thoughts
An effective finance report sample includes key components that provide a comprehensive view of a company’s financial health. Professionals who structure their reports with clear hierarchies and strategic visuals enhance readability and impact. Focusing on key performance indicators, providing context through benchmarking, and using appropriate visualizations help present financial data effectively.
Tailoring reports to different audiences ensures each stakeholder group receives relevant information. Clear and concise language makes complex financial information more accessible to all readers. A well-crafted finance report sample serves as a powerful tool for communication, decision-making, and strategic planning.
At Devine Consulting, we understand the importance of clear financial communication. Our accounting solutions, tailored for industries like construction and real estate, help businesses achieve financial stability and growth. We handle your financial reporting needs, ensuring you always have accurate and impactful finance reports at your fingertips.