How to Create an Effective Project Finance Report

Project finance reports are essential tools for decision-making in large-scale investments. They provide a comprehensive overview of a project’s financial viability and potential risks.
At Devine Consulting, we’ve seen how well-crafted reports can make or break investment decisions. This guide will walk you through the key elements of creating an effective project finance report, ensuring your next presentation stands out.
What Makes a Project Finance Report Effective?
The Executive Summary: Your Report’s Powerhouse
A powerful project finance report starts with a compelling executive summary. This section often serves as the only part busy executives read. Make it impactful. Condense key findings, financial projections, and major risks into two pages or less. Use bullet points strategically to emphasize critical numbers.
Project Overview: Setting the Stage
A clear project overview follows the executive summary. This section answers fundamental questions: What is the project? Why are we undertaking it? What are the objectives? Specificity is key. Instead of vague goals like “increase market share,” opt for precise targets such as “capture 15% of the regional widget market by 2026.”
Financial Projections: The Heart of Your Report
Financial projections form the core of your report. Present numbers with explanations of underlying assumptions. For instance, if you project 20% year-over-year growth, provide justification. This could include data from similar projects that achieved comparable growth rates or market analysis indicating strong demand. Solid reasoning should support all projections.
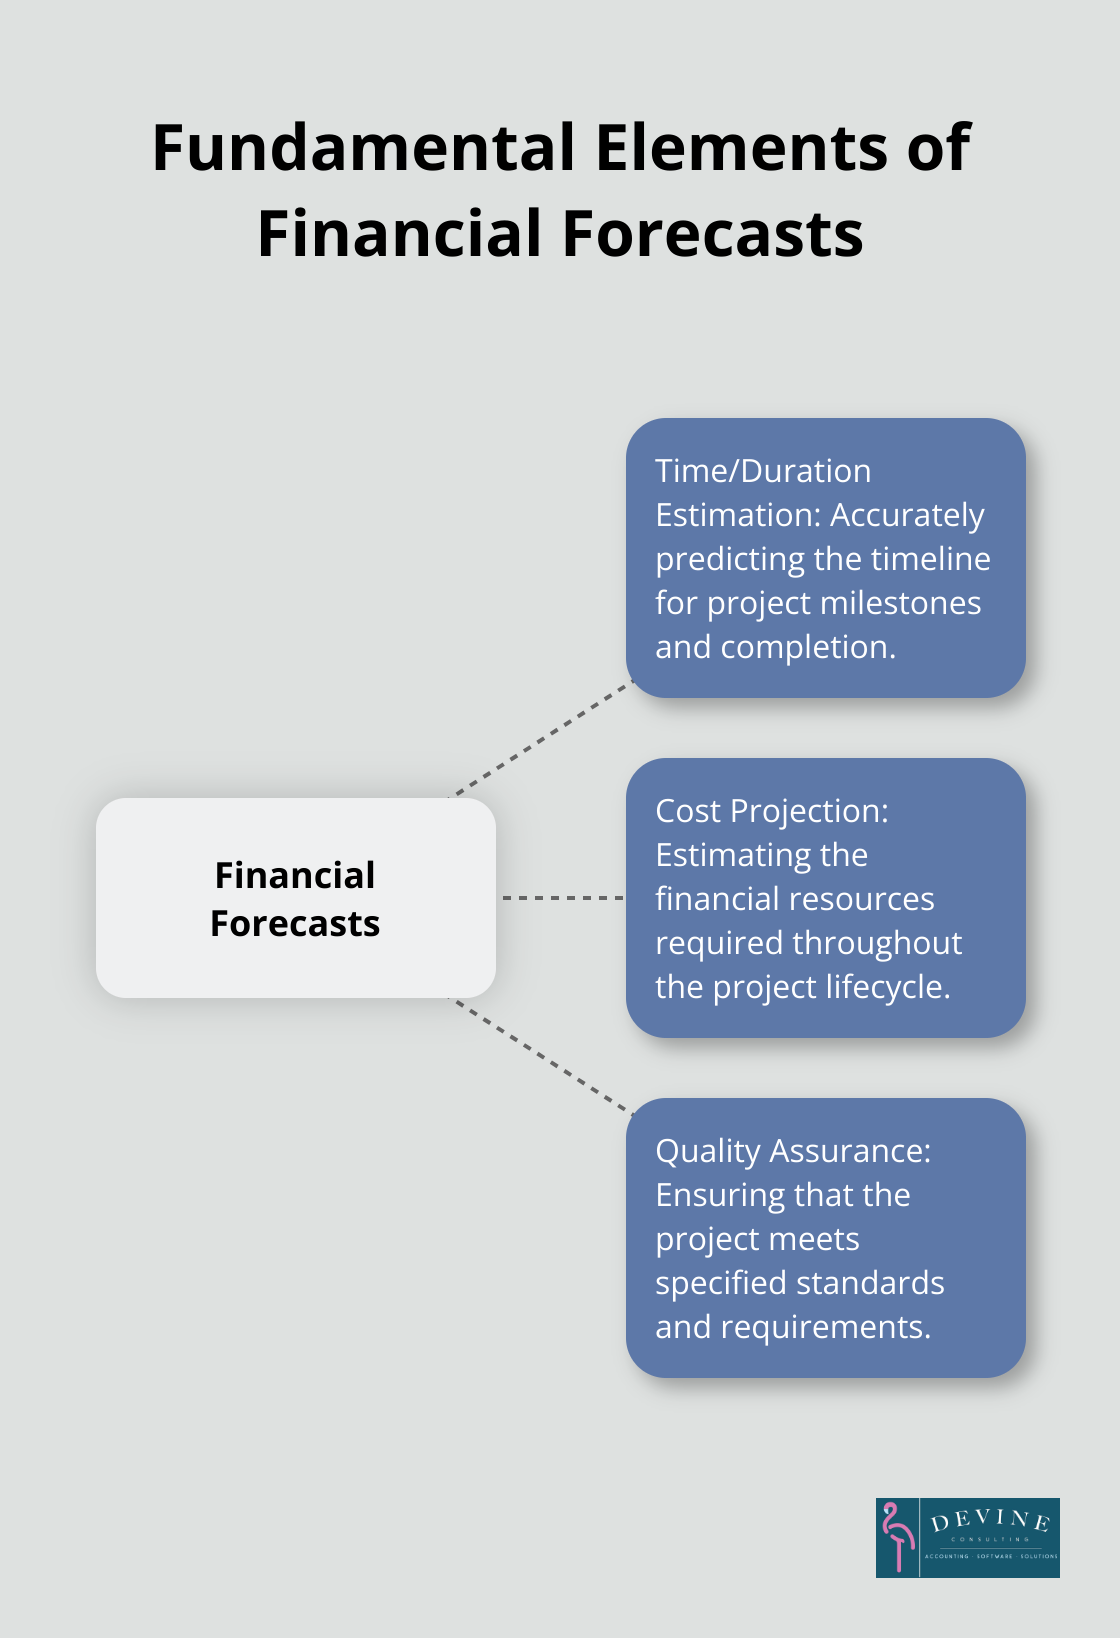
Financial forecasts rely on three fundamental elements: time/duration estimation, cost projection, and quality assurance. Accurate forecasting is crucial for project success.
Risk Analysis: Preparing for the Worst
Every project carries risks. Your report should identify potential pitfalls and outline plans to address them. A risk matrix can effectively visualize the likelihood and impact of various risks. Follow this with detailed mitigation strategies. For example, if currency fluctuations pose a significant risk, you might propose hedging strategies or local currency contracts.
Telling a Compelling Story
An effective project finance report goes beyond presenting information-it tells a story. It should paint a vivid picture of the project’s potential, supported by robust data and thoughtful analysis. The narrative should flow logically, guiding the reader through the project’s financial landscape.
As we move forward, let’s explore the critical process of data collection and analysis for project finance reports. This next section will provide insights into identifying key financial metrics and conducting thorough financial analysis.
How to Collect and Analyze Data for Project Finance Reports
Identifying Key Financial Metrics
The creation of compelling project finance reports starts with the identification of the right metrics. We focus on indicators that truly matter for specific projects. Common metrics include Net Present Value (NPV), Internal Rate of Return (IRR), and Payback Period. However, industry-specific metrics often offer deeper insights. For example, real estate projects benefit from metrics like Cap Rate or Cash-on-Cash Return.
The use of data and analytics is revolutionizing the business of insurance carriers in a digital world. This fact underscores the importance of choosing the right metrics and analyzing them effectively.
Gathering Relevant Financial Data
After the identification of key metrics, the next step involves the collection of necessary data. This process requires meticulous attention to detail and a keen understanding of data sources.
Historical data from similar projects provides a baseline for projections. Current market data, including interest rates, inflation forecasts, and industry-specific trends, also plays a vital role. The World Bank and IMF serve as excellent sources for macroeconomic data.
Primary research (such as surveys, interviews with industry experts, and on-the-ground assessments) can provide invaluable insights unavailable in public datasets.
Conducting Financial Analysis and Modeling
The construction of a financial model marks the critical phase in project finance reporting.
A detailed cash flow projection forms the foundation. This projection breaks down by month for the first year, then quarterly or annually for subsequent years. It accounts for all revenue streams and cost categories.
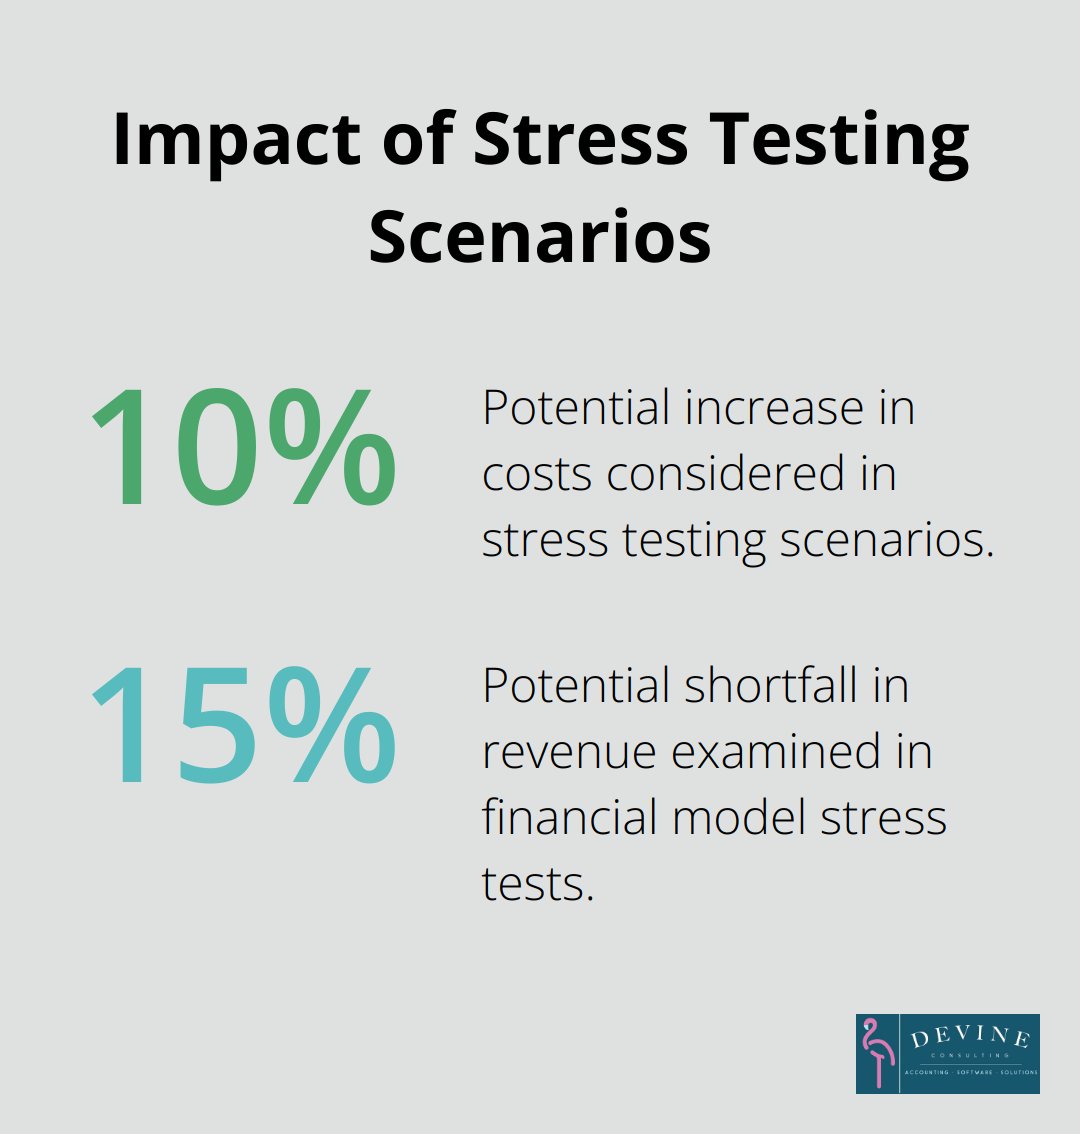
Stress testing the model follows. This process examines scenarios such as a 10% increase in costs or a 15% shortfall in revenue. These scenarios help stakeholders understand the project’s resilience to adverse conditions.
Sensitivity analysis serves as another powerful tool. It demonstrates how changes in key variables affect the project’s overall financial performance. For instance, it might show how interest rate fluctuations impact the project’s NPV.
For complex projects, Monte Carlo simulation offers additional insights. This technique estimates the likelihood of different outcomes by accounting for the presence of random variables. While more complex, it offers a nuanced view of project risks and potential returns.
The goal extends beyond number crunching. It aims to tell a compelling story about the project’s financial future. The analysis should paint a clear picture of the project’s potential, backed by solid data and rigorous analysis.
Clients appreciate reports that go beyond basic projections. They seek insights that facilitate informed decision-making. The application of these steps sets the foundation for a project finance report that truly adds value.
Now that we’ve covered data collection and analysis, let’s explore how to present this information effectively. The next section will discuss best practices for presenting financial information in a clear, concise, and visually appealing manner.
How to Present Financial Information Effectively
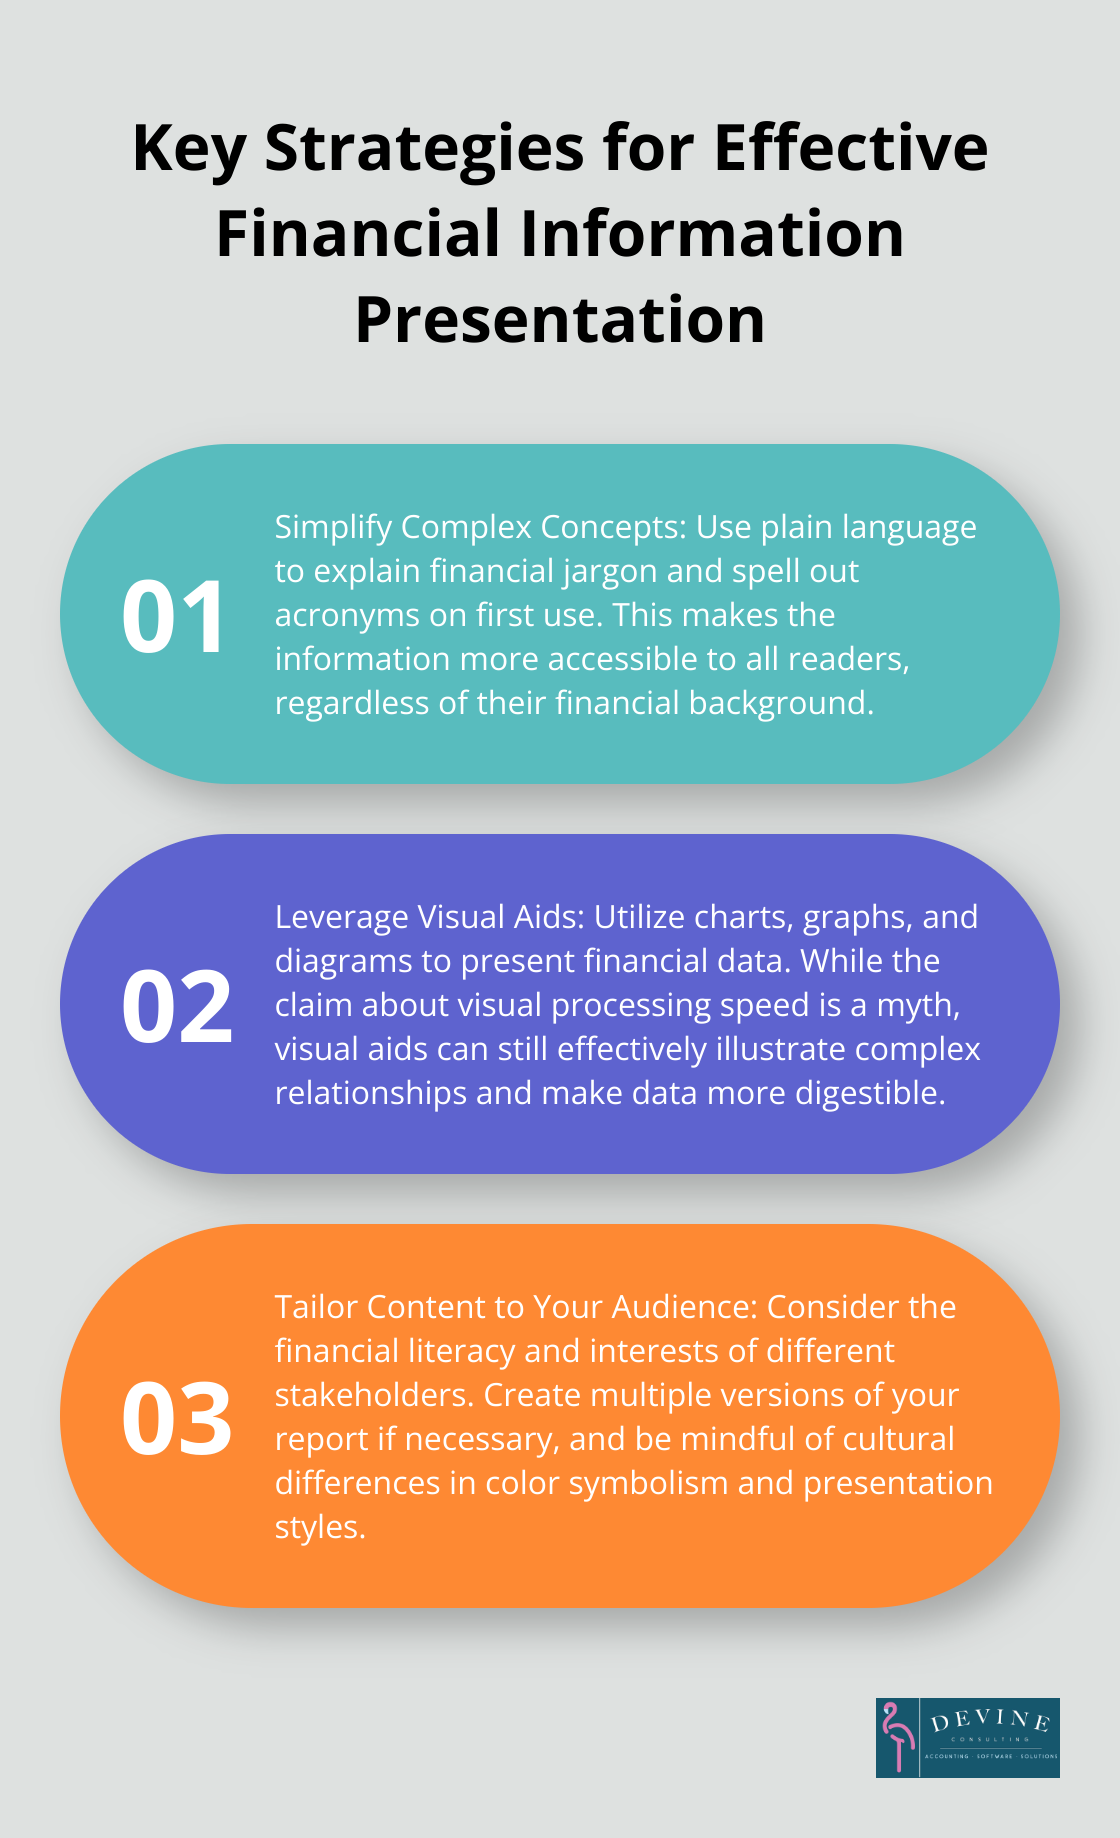
Simplify Complex Concepts
Financial jargon can overwhelm readers. We recommend the use of plain language to explain complex financial concepts. Instead of stating “The project has a positive NPV,” try “The project will generate more cash than it costs over its lifetime.”
Avoid acronyms where possible. If you must use them, spell them out on first use. For example, write “Internal Rate of Return (IRR)” before using “IRR” throughout the rest of the report.
Leverage Visual Aids
The claim that humans process visual information 60,000 times faster than text is a myth. However, visual aids can still be effective in presenting financial information.
Bar charts work well for comparing different scenarios or showing changes over time. Pie charts effectively illustrate the composition of costs or revenue streams. For more complex relationships, try scatter plots or bubble charts.
Tailor Content to Your Audience
Different stakeholders have varying levels of financial literacy and interests. A CFO might want to examine the financial models in depth, while a board member might prefer a high-level overview of key metrics.
Create multiple versions of your report if necessary. A detailed technical appendix can satisfy number-crunchers without overwhelming other readers.
Consider the cultural background of your audience as well. In some cultures, red might signify danger or loss, while in others it represents good fortune. Choose colors and symbols that resonate positively with your audience.
Use Storytelling Techniques
Numbers alone rarely inspire action. Frame your financial data within a compelling narrative. Start with the problem your project aims to solve, then use financial projections to show how it will create value.
Don’t just state that the project has an IRR of 15%. Explain what that means in real terms: “This project will generate returns that are 5 percentage points higher than our company’s average over the past decade.”
These strategies will help you create a project finance report that not only informs but also engages and persuades your audience. The goal is not just to present data, but to facilitate informed decision-making.
Final Thoughts
Creating an effective project finance report requires skill and attention to detail. Accuracy and transparency form the foundation of these reports, as they inform significant investment decisions. We recommend double-checking calculations, verifying sources, and clearly stating any assumptions or limitations in your analysis.
Continuous improvement in reporting skills comes from seeking stakeholder feedback and staying updated on industry trends. We suggest attending workshops on financial modeling and data visualization to enhance your expertise. The ultimate goal of a project finance report extends beyond presenting numbers; it provides actionable insights for informed decision-making.
At Devine Consulting, we understand the intricacies of financial reporting across various industries. Our team of experts can help you create comprehensive project finance reports that meet high standards of accuracy and clarity. You can focus on your core business while we ensure your financial reporting remains in capable hands.