How to Create an Inventory Management Finance Project Report

At Devine Consulting, we know that creating an inventory management finance project report is a critical task for businesses of all sizes.
This comprehensive guide will walk you through the process, from understanding key financial metrics to structuring your report for maximum impact.
We’ll show you how to gather and analyze relevant data, ensuring your report provides valuable insights for financial decision-making.
What Are the Basics of Inventory Management?
The Core of Inventory Management
Inventory management forms the backbone of financial health for businesses across industries. It involves having the right products in the right quantities at the right time. However, it extends beyond simply counting items on shelves.
The Financial Impact of Inventory
Effective inventory management directly affects a company’s bottom line. A study by the National Retail Federation helps retailers take note of the incremental and significant changes within loss prevention as the industry continues to evolve. This underscores the importance of tracking and managing inventory for financial success.
Essential Financial Metrics
Several financial metrics play a key role in robust inventory management:
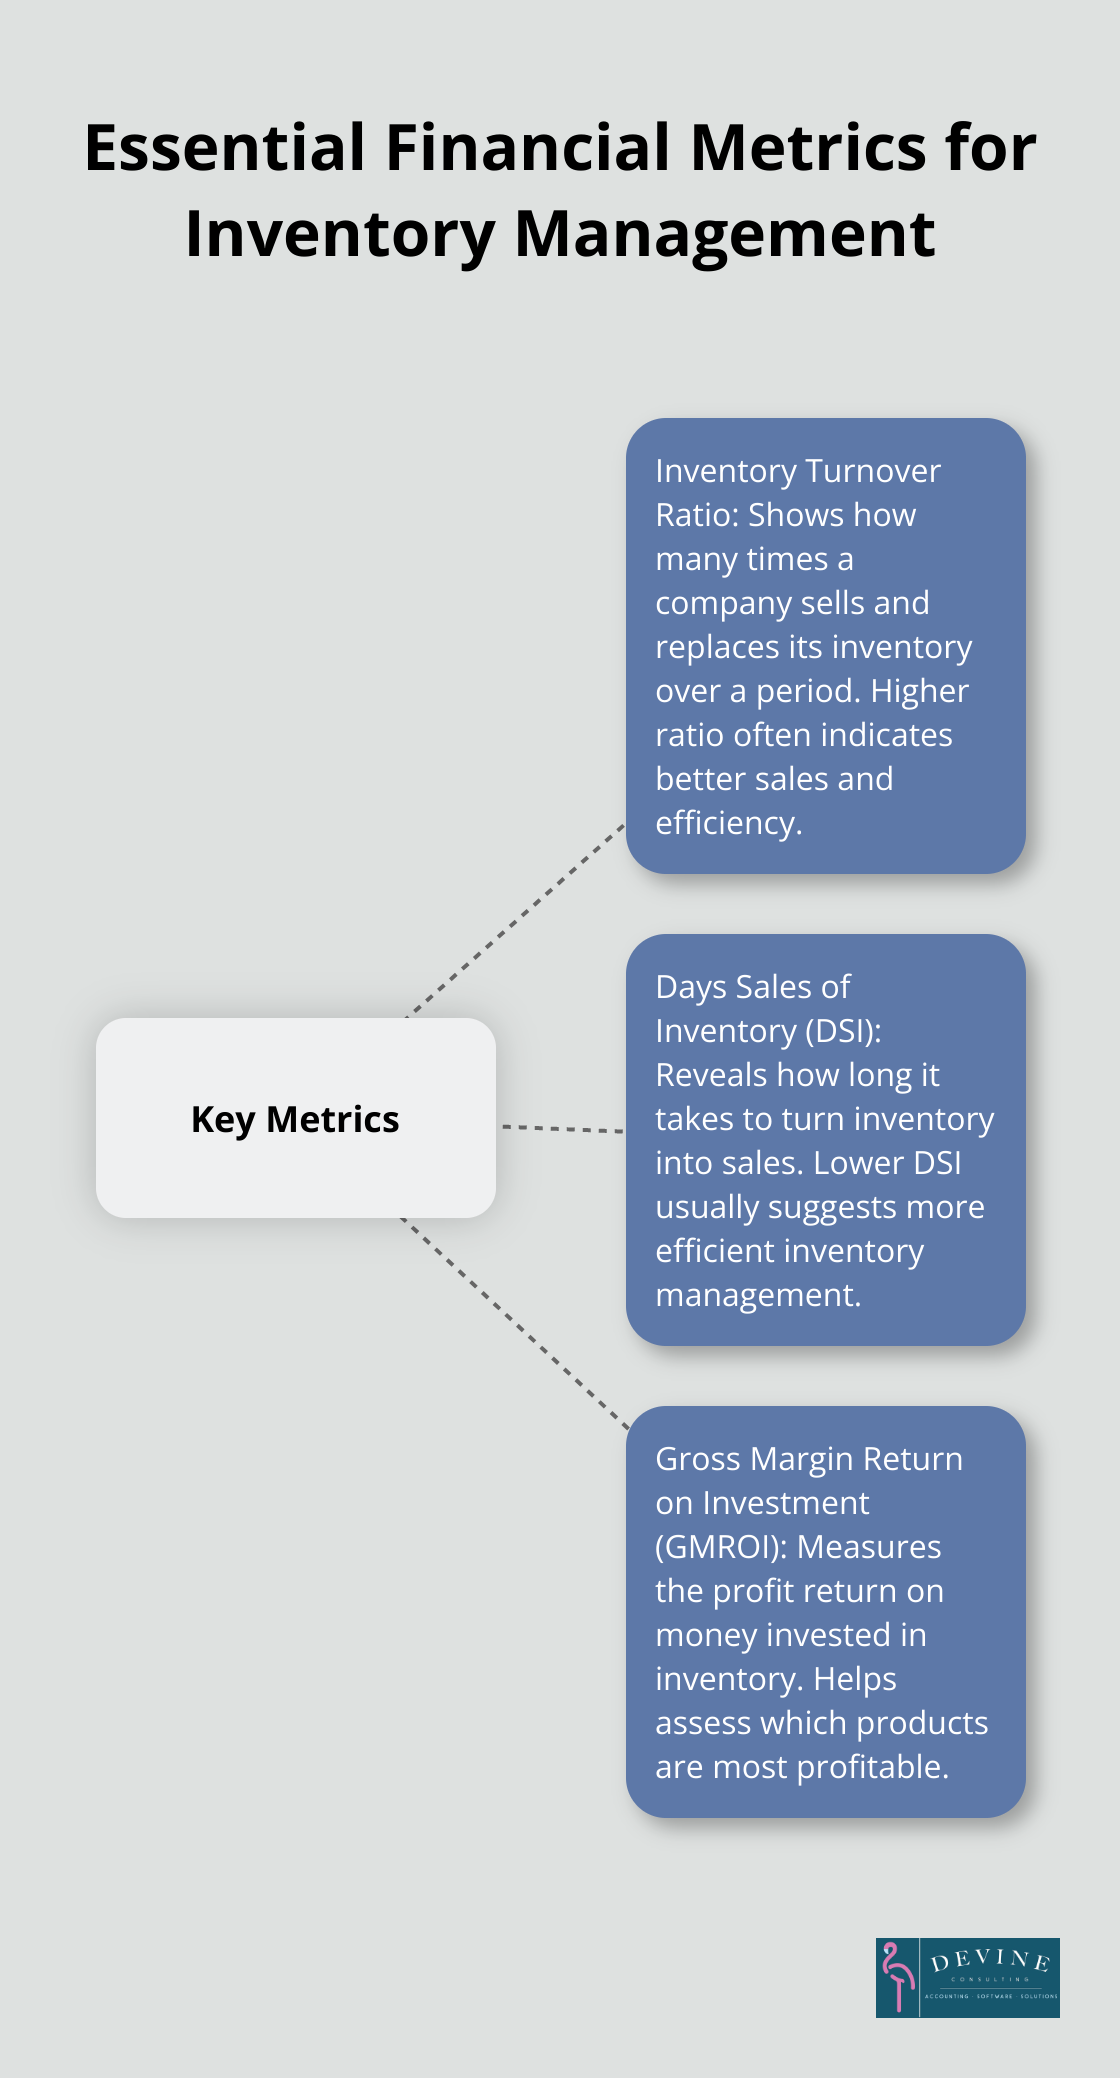
- Inventory Turnover Ratio: This metric shows how many times a company sells and replaces its inventory over a period. A higher ratio often indicates better sales and efficiency.
- Days Sales of Inventory (DSI): DSI reveals how long it takes to turn inventory into sales. A lower DSI usually suggests more efficient inventory management.
- Gross Margin Return on Investment (GMROI): GMROI measures the profit return on the money invested in inventory. It helps assess which products are most profitable.
Inventory’s Role in Financial Statements
Inventory has a significant presence on financial statements. On the balance sheet, it typically represents one of the largest current assets. Changes in inventory levels can dramatically affect the current ratio (a key measure of liquidity).
On the income statement, inventory costs directly impact the cost of goods sold (COGS) and, consequently, gross profit. Inaccurate inventory valuation can lead to misstatements in financial reports, potentially misleading stakeholders and investors.
Practical Tips for Improved Inventory Management
- Implement a robust inventory tracking system. Many businesses find success with software solutions that offer real-time updates and analytics.
- Conduct regular physical inventory counts. This practice helps identify discrepancies between recorded and actual inventory levels.
- Use the ABC analysis method to prioritize inventory management efforts. This involves categorizing items based on their importance and value to the business.
Mastering these basics can transform inventory management from a necessary task into a strategic advantage. The next section will explore how to gather and analyze the data needed for a comprehensive inventory management finance report.
How to Gather Data for Your Inventory Finance Report
Identify Key Data Sources
The first step in creating an inventory finance report is to pinpoint where your inventory data resides. This often includes point-of-sale systems, warehouse management software, and enterprise resource planning (ERP) systems. Don’t overlook less obvious sources like customer returns data or supplier lead times.
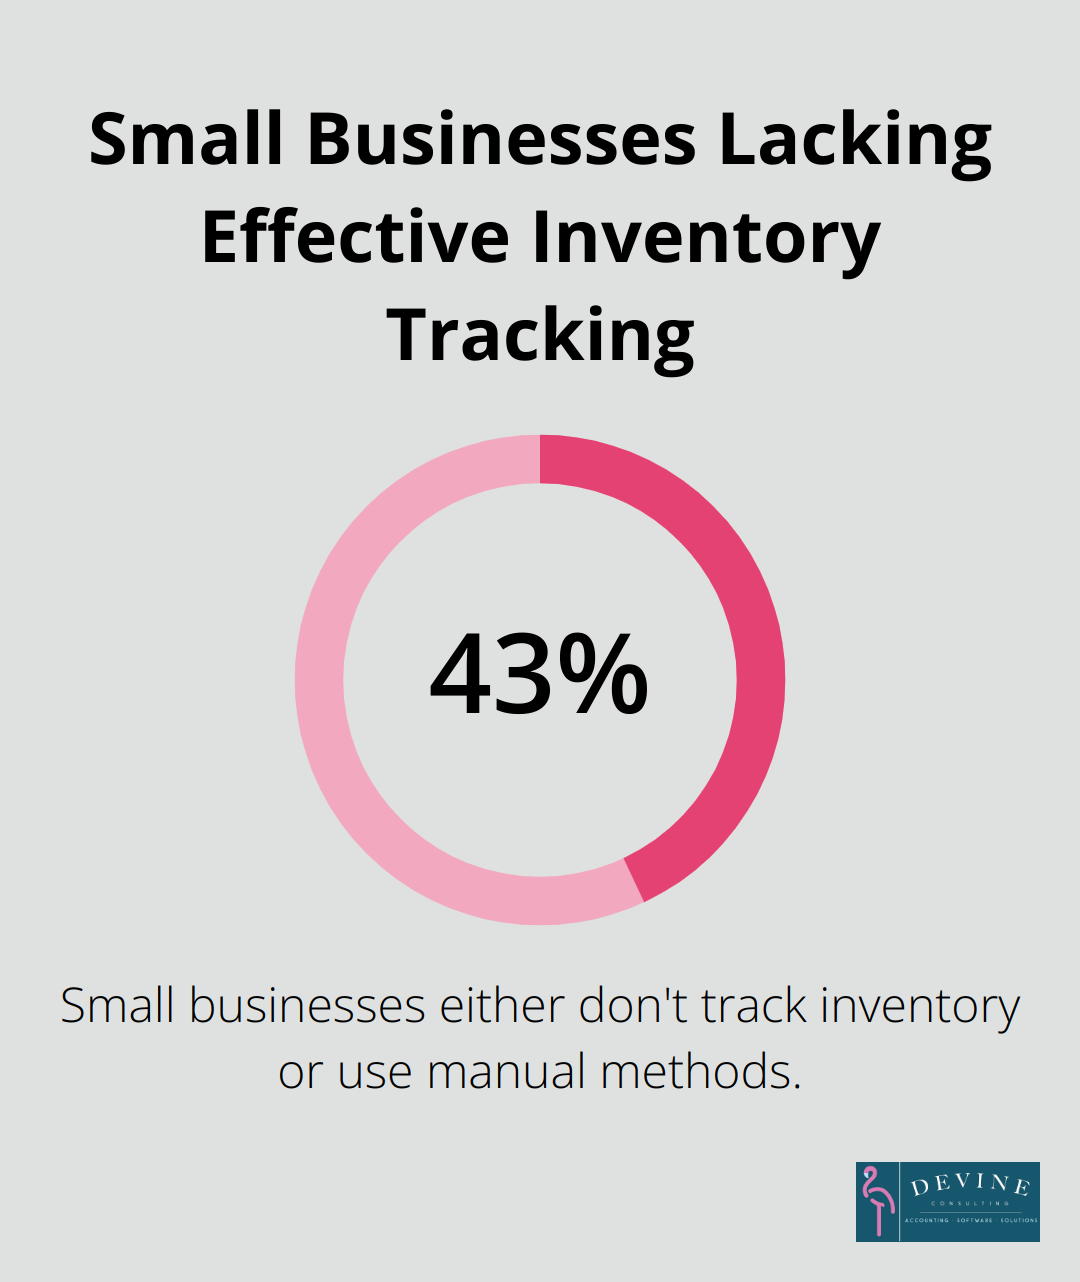
A survey by Wasp Barcode Technologies found that 43% of small businesses either don’t track inventory or use manual methods. This highlights a significant opportunity for improvement through better data sourcing.
Collect Historical Data
Historical inventory and sales data provide insights into trends and patterns. Try to gather at least two years of data, if possible. This should include:
- Monthly sales figures for each product
- Inventory levels at regular intervals (daily or weekly)
- Purchase order history
- Stockout incidents
- Seasonal fluctuations in demand
The Aberdeen Group reports that companies with real-time visibility into their inventory data reduce out-of-stock rates by 30%. This underscores the importance of comprehensive data collection.
Analyze Inventory Metrics
Once you’ve gathered your data, it’s time to calculate key metrics. Focus on:
- Inventory Turnover Ratio: Divide the cost of goods sold by average inventory value. A higher ratio typically indicates more efficient inventory management.
- Carrying Costs: Include capital costs, storage costs, service costs, and inventory risk costs.
- Stock-to-Sales Ratio: Compare inventory levels to sales over time. This helps identify overstocking or understocking issues.
- Gross Margin Return on Investment (GMROI): Calculate by dividing your gross margin by average inventory cost. This metric helps assess which products are most profitable.
- Days Sales of Inventory (DSI): Determine how long it takes to turn inventory into sales. Lower DSI usually indicates more efficient inventory management.
Leverage Technology for Data Collection
Modern inventory management systems can automate much of the data collection process. These systems can provide real-time updates on inventory levels, sales, and other key metrics. This not only saves time but also improves accuracy and allows for more timely decision-making.
With a solid foundation of data, you’re now ready to structure your inventory management finance report for maximum impact. The next section will guide you through this process, ensuring your report provides valuable insights for financial decision-making.
How to Structure Your Inventory Management Finance Report
Start with an Executive Summary
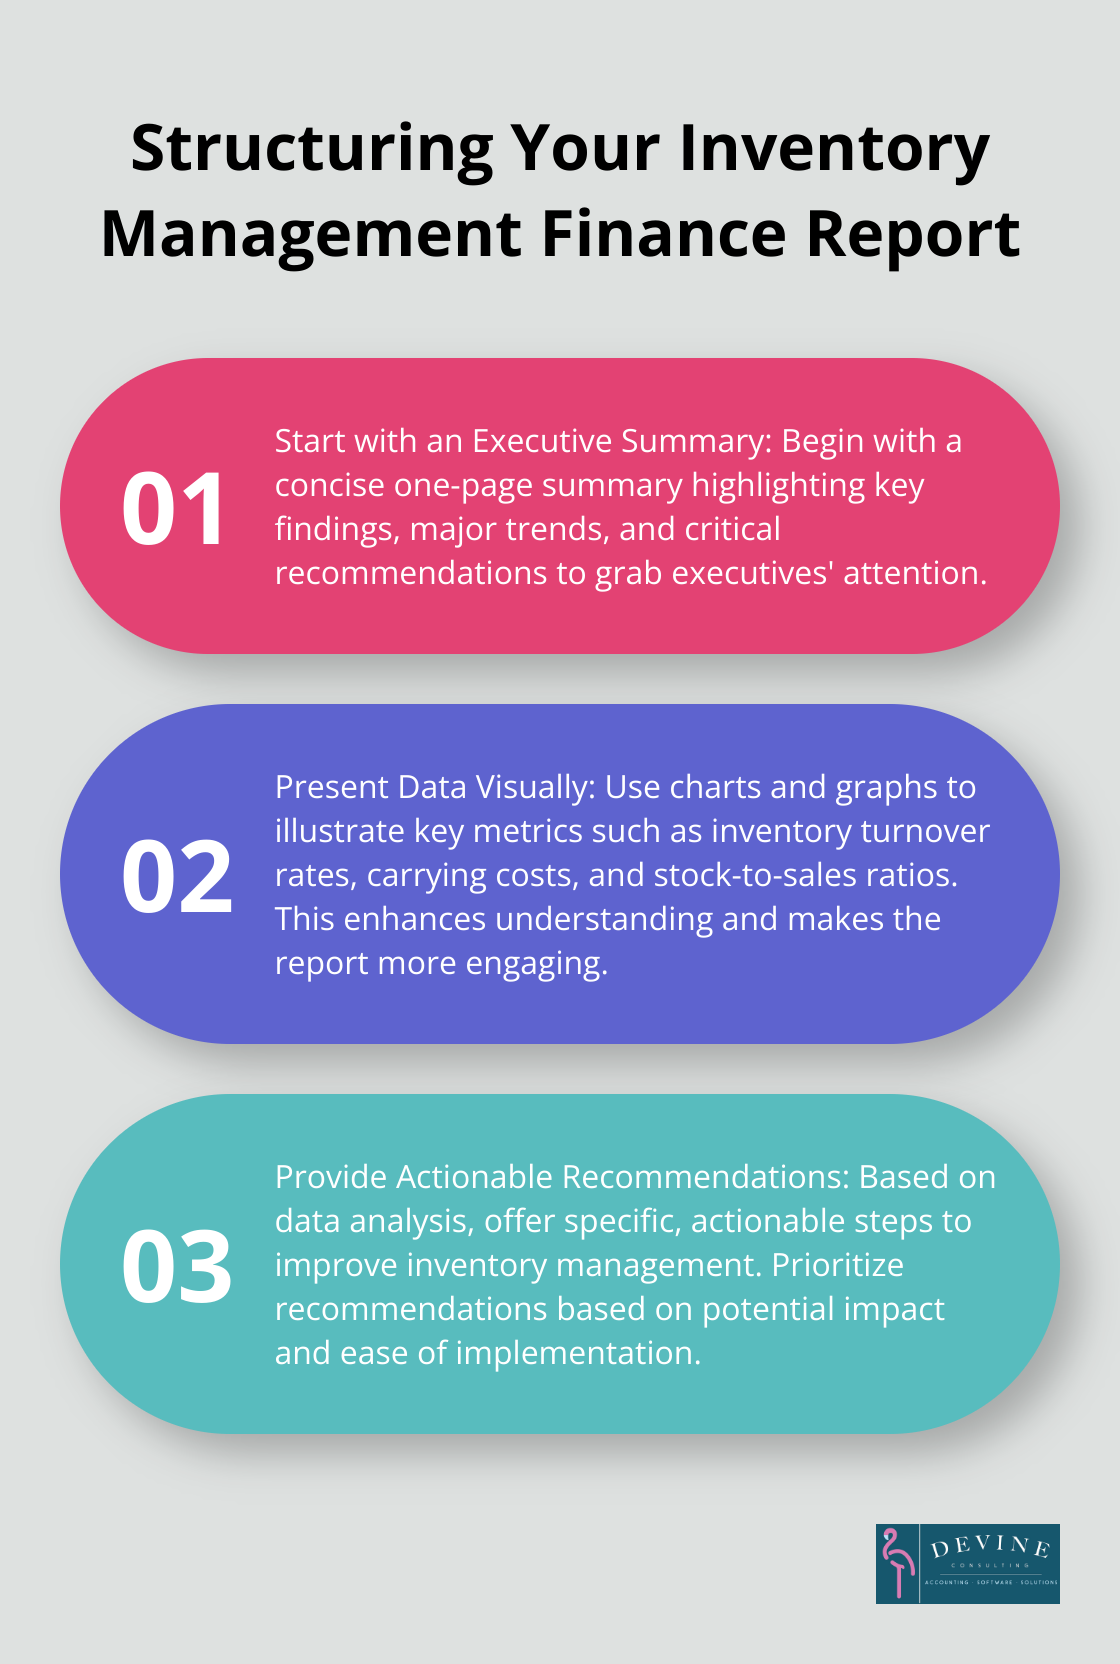
Begin your report with a concise executive summary. This section should highlight key findings, major trends, and critical recommendations. Try to keep it to one page, focusing on the most important takeaways that will grab the attention of busy executives.
Present Data Visually
Visual representations of data can dramatically enhance understanding. Include charts and graphs that illustrate key metrics such as inventory turnover rates, carrying costs, and stock-to-sales ratios.
We recommend using a combination of bar charts (for comparing metrics across different product categories), line graphs (for showing trends over time), and pie charts (for displaying the composition of inventory costs). Tools like Tableau or Microsoft Power BI can help create compelling visualizations.
Analyze Trends and Patterns
Dedicate a section to analyzing trends and patterns in your inventory data. This might include seasonal fluctuations in demand, changes in inventory turnover rates, or shifts in product mix. For example, you might notice that certain products have consistently low turnover rates, indicating potential overstock issues.
Use this section to explore the reasons behind these trends. Are slow-moving items due to changes in customer preferences, or are they a result of ineffective marketing strategies? This analysis will form the foundation for your recommendations.
Provide Actionable Recommendations
The most valuable part of your report is the recommendations section. Based on your data analysis, provide specific, actionable steps to improve inventory management. For instance, if you’ve identified products with high carrying costs and low turnover, you might recommend implementing a just-in-time inventory system for these items.
Prioritize your recommendations based on potential impact and ease of implementation. According to a report, companies that use predictive analytics are 2.8 times more likely to experience significant revenue growth.
Include a Financial Impact Assessment
Conclude your report with a section that outlines the potential financial impact of your recommendations. This might include projected cost savings from reduced carrying costs, increased revenue from improved stock availability, or enhanced cash flow from optimized inventory levels.
Use concrete numbers whenever possible. For example, “Implementing these recommendations could reduce carrying costs by 15% (potentially saving the company $500,000 annually).” This financial context helps decision-makers understand the value of acting on your insights.
The goal of your inventory management finance report is not just to present data, but to drive action that improves financial performance. This structure will create a report that not only informs but also influences key business decisions.
Final Thoughts
An inventory management finance project report empowers businesses to optimize their financial performance. Companies can gain valuable insights that drive informed decision-making through careful analysis of key metrics like inventory turnover ratio and carrying costs. The process involves several steps, from identifying data sources to presenting findings visually, each contributing to a comprehensive understanding of inventory performance.
A well-crafted inventory management finance project report provides actionable recommendations backed by data-driven insights. These recommendations, when implemented, can lead to significant cost savings, improved cash flow, and enhanced overall financial health. Modern inventory management systems streamline this process and ensure accuracy in reporting, transforming inventory practices from a necessary task into a strategic advantage.
At Devine Consulting, we understand the critical role that inventory management plays in financial success. Our comprehensive accounting solutions help businesses across various industries optimize their inventory processes. We enable companies to make informed decisions, allocate resources effectively, and stay ahead of market trends, positioning them for long-term success and financial prosperity.