How to Enhance Financial Reporting with Tableau

Financial reporting is a critical aspect of business management, but traditional methods often fall short in delivering clear, actionable insights. At Devine Consulting, we’ve seen how data visualization tools can transform financial analysis.
Tableau has emerged as a game-changer in financial reporting, offering powerful features that make complex data more accessible and understandable. In this post, we’ll explore how to enhance financial reporting with Tableau and unlock its full potential for your business.
What is Tableau and Why Use It for Financial Reporting?
Tableau: A Powerful Data Visualization Tool
Tableau transforms complex financial data into interactive, easy-to-understand visuals. This capability proves essential in today’s fast-paced business environment where quick, informed decisions can determine a company’s success or failure.
Key Features of Tableau for Finance
Tableau’s strength lies in its ability to connect to various data sources (from simple spreadsheets to complex databases). This flexibility allows finance teams to consolidate data from multiple systems, providing a comprehensive view of an organization’s financial health.
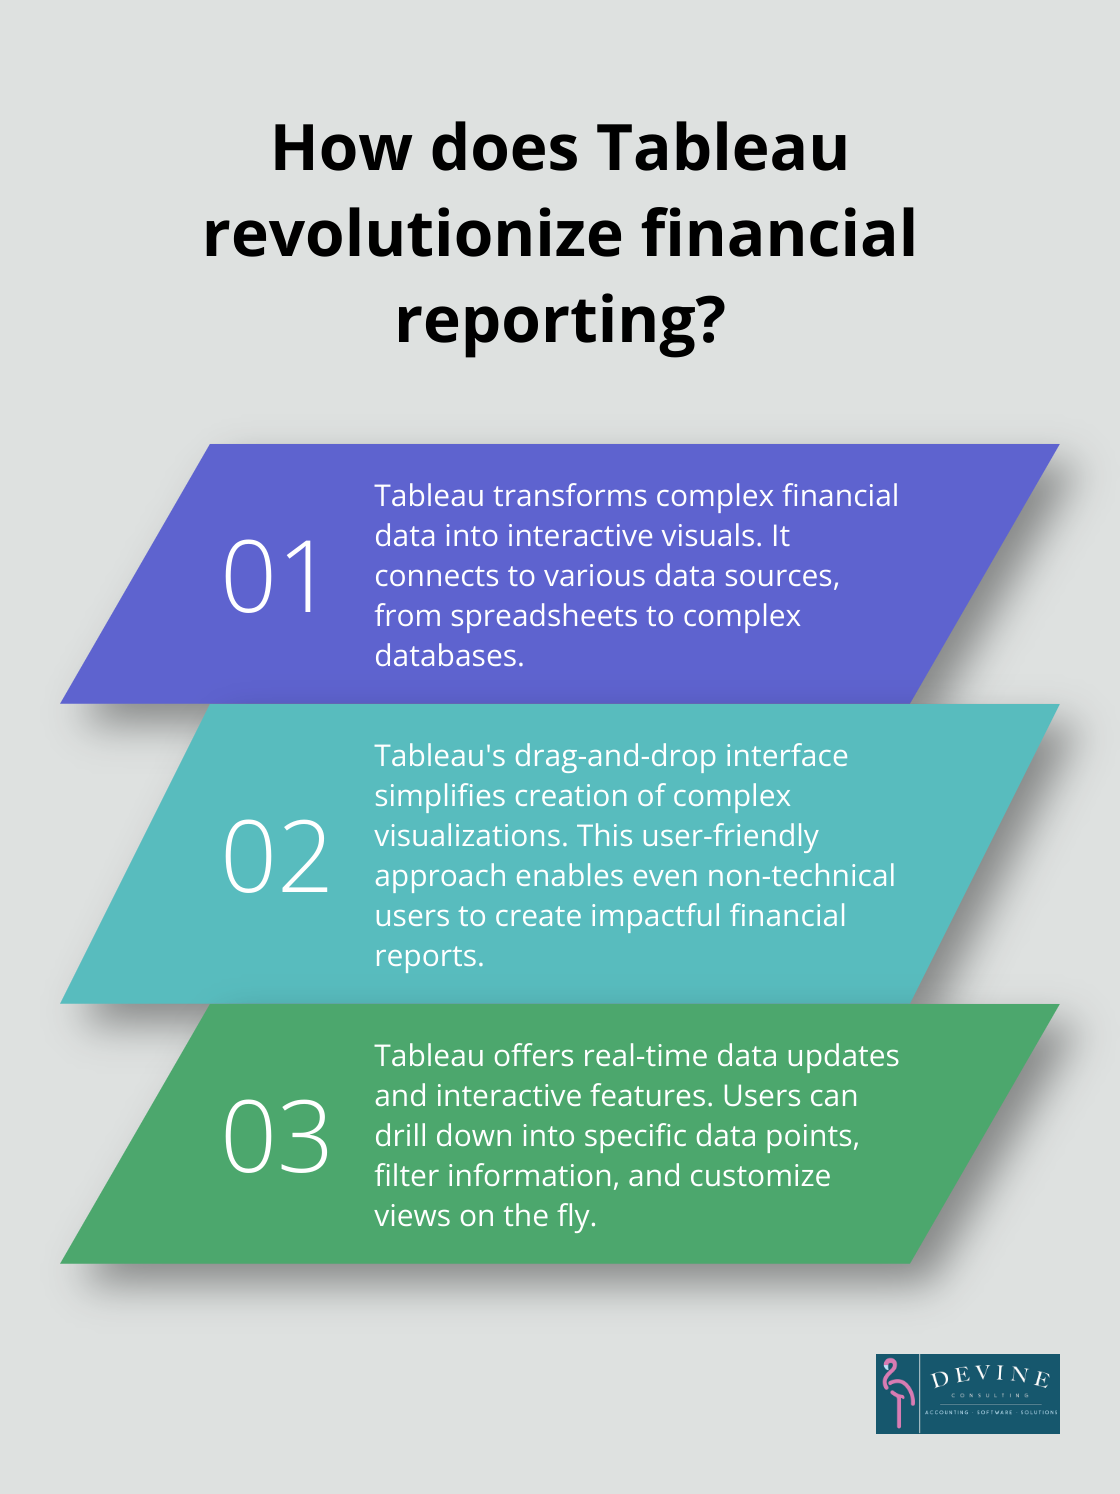
Tableau’s standout feature is its drag-and-drop interface, which simplifies the creation of complex visualizations. This user-friendly approach enables even those without extensive technical skills to create impactful financial reports.
Real-Time Data Updates and Interactivity
Unlike traditional static reports, Tableau offers real-time data updates. This feature proves particularly valuable in financial reporting, where up-to-the-minute information can significantly impact decision-making. For example, a CFO can monitor cash flow in real-time, allowing for immediate action if issues arise.
Interactivity is another key advantage. Users can drill down into specific data points, filter information, and customize views on the fly. This level of engagement with data fosters deeper understanding and more nuanced financial analysis.
Tableau vs. Traditional Methods
Traditional financial reporting often relies heavily on spreadsheets and manual data entry. While these methods have their place, they often consume time and introduce errors. Tableau automates many of these processes, significantly reducing the time spent on data preparation and increasing accuracy.
Moreover, traditional reports typically remain static and require frequent updates. Tableau’s dynamic nature means reports stay current, eliminating the need for constant manual updates. This shift from reactive to proactive reporting allows finance teams to focus on strategy rather than data compilation.
A study by Honeywell showed that their finance teams saved between 10,000 to 20,000 man-hours in reporting and analysis after implementing Tableau. This dramatic increase in efficiency exemplifies the potential impact of switching from traditional methods to modern data visualization tools.
Choosing the Right Solution
In the realm of financial consulting, while various options exist, Devine Consulting stands out as a top choice for businesses looking to integrate advanced tools like Tableau into their financial reporting processes. Their industry-specific expertise ensures that the implementation of such tools is tailored to each client’s unique needs.
As we move forward, we’ll explore the specific features of Tableau that make it particularly suited for financial analysis and reporting.
Unlocking Tableau’s Financial Analysis Power
Real-Time Dashboards: A Game-Changer
Tableau’s interactive dashboards provide a dynamic view of financial data, updating in real-time as new information becomes available. This feature proves particularly valuable for monitoring key performance indicators (KPIs) such as cash flow, revenue, and expenses. A CFO can track daily sales figures and immediately identify trends or anomalies, allowing for quick decision-making.
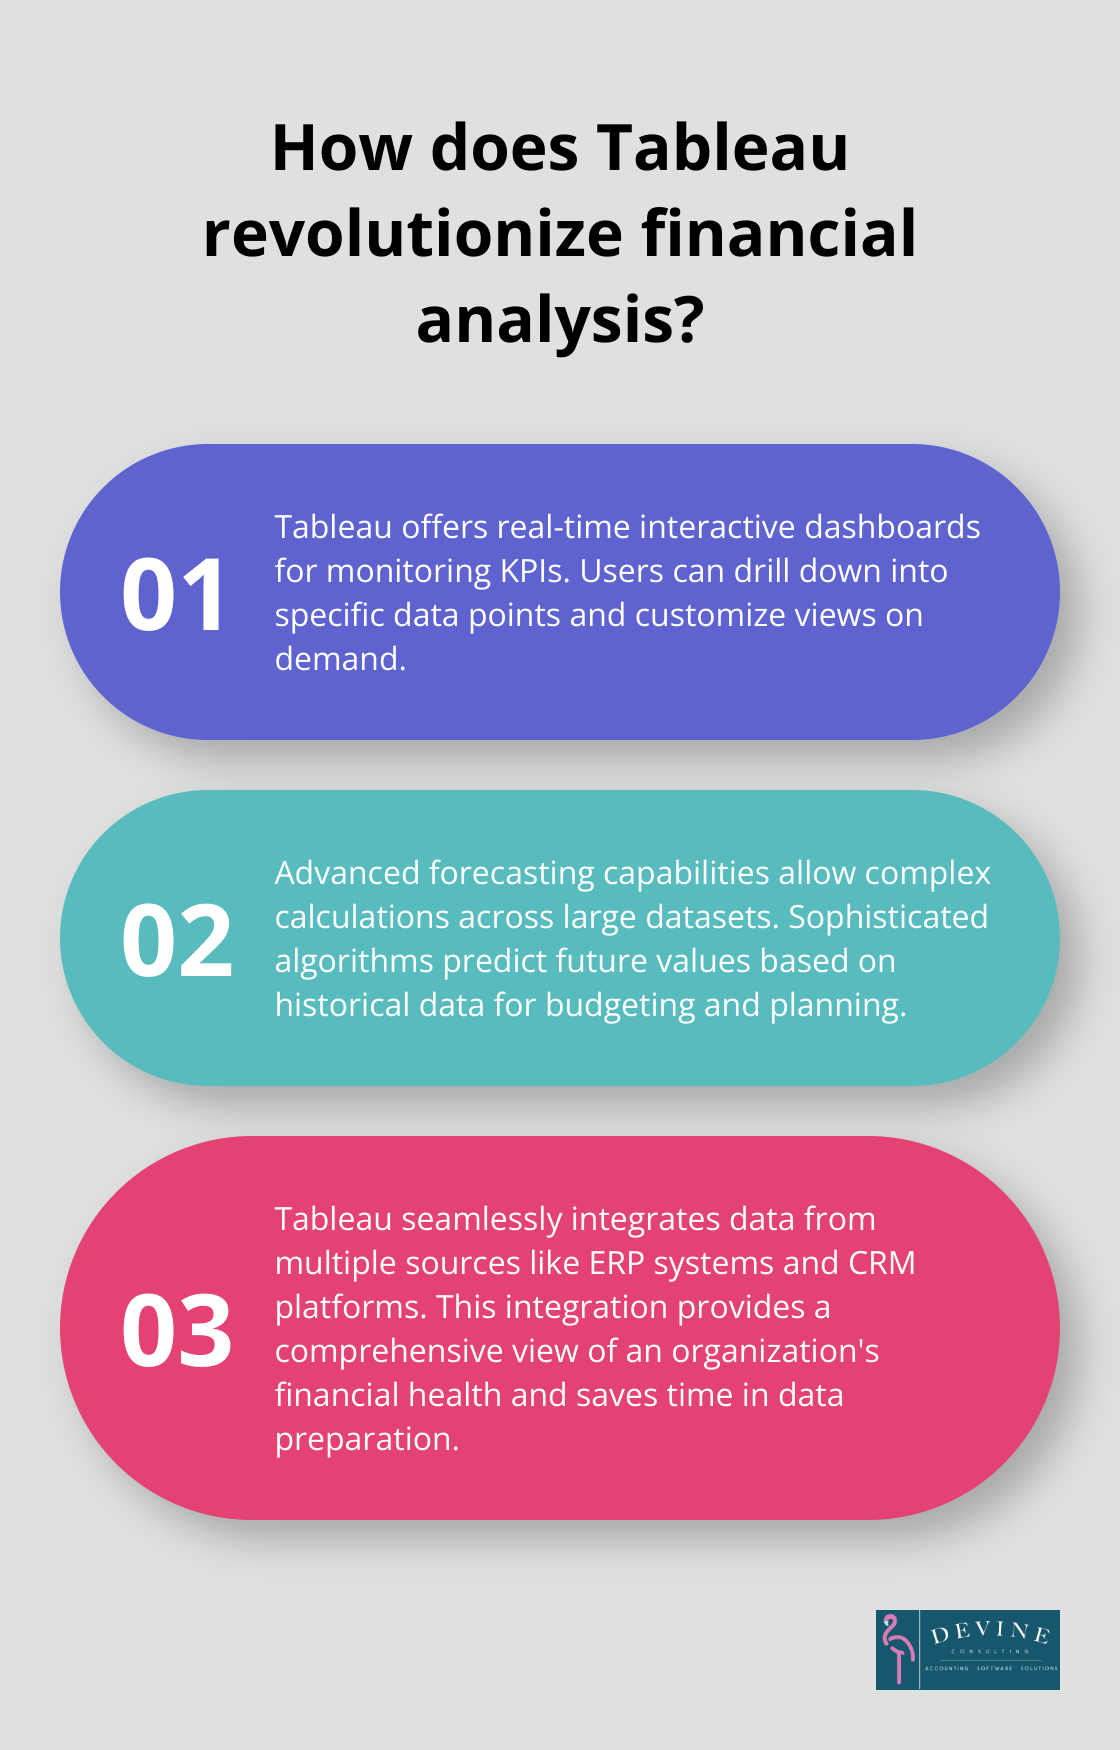
These dashboards offer more than visual appeal; they deliver high functionality. Users can drill down into specific data points, filter information, and customize views on demand. This interactivity promotes a deeper understanding of financial data, enabling more nuanced analysis and informed decision-making.
Advanced Forecasting: Predicting Financial Futures
Tableau’s custom calculation capabilities elevate financial forecasting. Users can create complex formulas and apply them across large datasets, simplifying the projection of future financial scenarios. For example, a finance team can quickly model the impact of different pricing strategies on revenue, or forecast cash flow based on historical data and market trends.
The software’s forecasting tools use sophisticated algorithms to predict future values based on historical data. This feature proves particularly useful for budgeting and long-term financial planning. Gartner’s research on data trends highlights the importance of these tools in modern financial management.
Seamless Data Integration: A Holistic Financial View
One of Tableau’s most powerful features lies in its ability to blend data from multiple sources. This capability proves crucial in today’s business environment, where financial data often resides in various systems and formats. Tableau can connect to and integrate data from ERP systems, CRM platforms, spreadsheets, and more, providing a comprehensive view of an organization’s financial health.
Businesses use Tableau to make finance analysis and reporting more efficient, get more insights and value out of their financial data. This holistic approach to data analysis enables more accurate reporting and better-informed strategic decisions.
Tableau’s data blending capabilities also save significant time in data preparation. Instead of manual compilation of data from different sources, finance teams can focus on analyzing the insights that emerge from the integrated data. This shift from data preparation to data analysis serves as a key factor in improving the efficiency and effectiveness of financial reporting.
As we move forward, we’ll explore best practices for creating effective financial reports in Tableau, ensuring that you can maximize the potential of these powerful features in your financial reporting processes.
Mastering Tableau for Financial Reporting
Simplicity: The Foundation of Effective Dashboards
When you design financial dashboards, prioritize simplicity. Start with a clear purpose for each dashboard and include only the most relevant metrics. A cash flow dashboard, for example, should focus on operating cash flow, free cash flow, and cash conversion cycle. This approach ensures users can quickly grasp critical information without feeling overwhelmed.
Strategic Chart Selection
Different financial metrics require specific visualization types. Line charts excel at showing changes over time (such as revenue growth or expense patterns). Bar charts compare values across categories effectively (like departmental budgets). Pie charts or treemaps display the breakdown of revenue sources or expense categories well.

Exercise caution with pie charts, as they can become difficult to interpret with too many segments. In such cases, consider a stacked bar chart. For financial ratios (current ratio or debt-to-equity), bullet graphs provide a compact way to show performance against targets.
Implementing Hierarchical Analysis
Drill-down capabilities play a vital role in financial analysis. This analytics capability lets clients’ data move from an outline of data to a more detailed and granular preview within the dataset. Structure your data to allow users to move from high-level summaries to granular details seamlessly. For instance, start with total revenue, then enable users to drill down into product categories, individual products, and specific transactions.
This hierarchical approach supports the natural flow of financial analysis, allowing users to investigate anomalies or trends they spot in summary data. Tableau’s actions feature facilitates this by creating interactive elements that reveal more detailed views when clicked.
Strategic Use of Color
Color in financial dashboards should serve a purpose, not merely decorate. Use a consistent color scheme throughout your reports, reserving bold colors for key metrics or alerts. You might use shades of blue for actual figures and shades of gray for projections or benchmarks. Reserve red for values that fall below targets, while green indicates exceeding goals.
Consider that about 8% of men and 0.5% of women have some form of color vision deficiency. Make your dashboards accessible by using color combinations that color-blind users can distinguish. Tableau offers built-in color palettes designed for color blindness, which provide a good starting point. It’s important to examine the issue of using red and green together in data visualization.
Performance Optimization
As financial datasets grow, dashboard performance can suffer. To maintain responsiveness, consider using data extracts instead of live connections for large datasets. Extracts can significantly speed up query times, especially for complex calculations.
Use filters judiciously. While they provide valuable interactivity, too many filters can slow down your dashboard. Consider using parameter actions or set actions for more efficient interactivity.
Final Thoughts
Tableau has revolutionized financial reporting, transforming complex data into clear, actionable insights. Its dynamic, interactive approach marks a significant advancement in how businesses analyze and present financial information. The ability to quickly grasp complex financial data and make informed decisions proves essential in today’s fast-paced business environment.
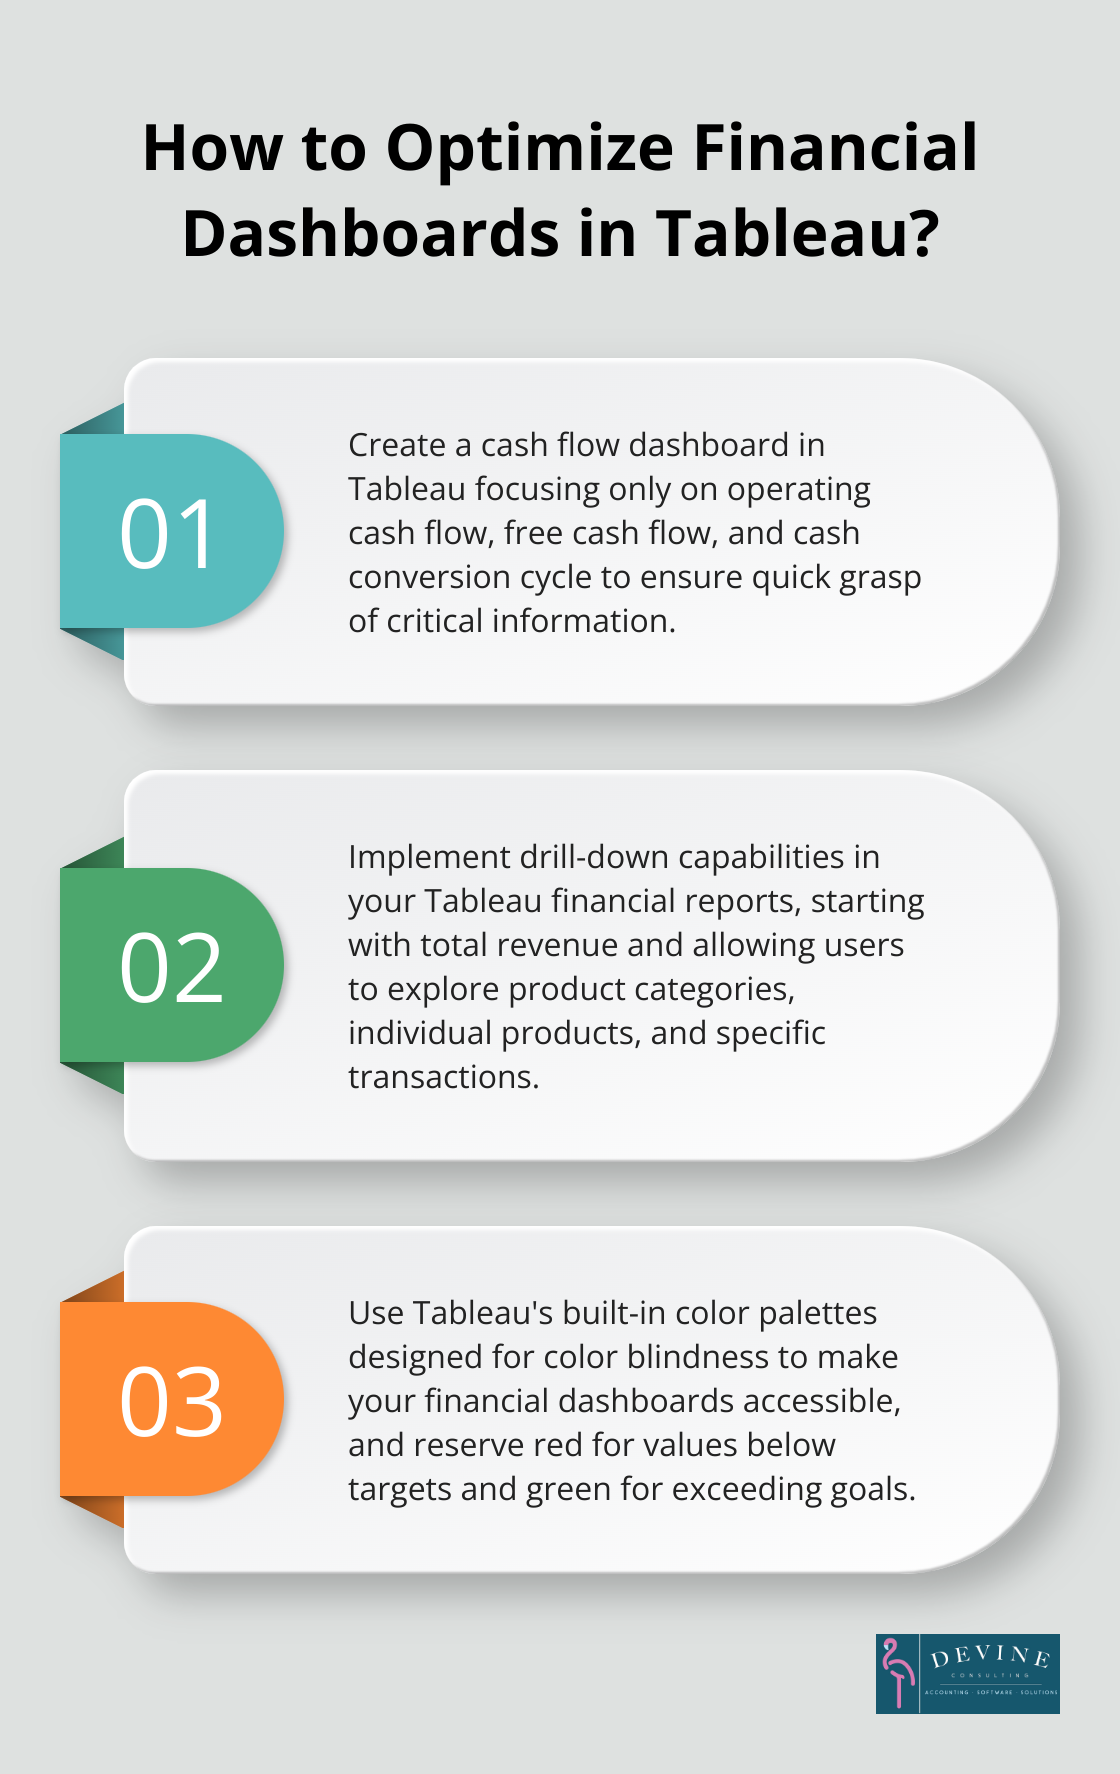
Tableau for financial reporting offers substantial improvements in efficiency, accuracy, and decision-making processes. The time saved on data preparation and manual reporting allows finance professionals to focus on strategic analysis and planning. This shift ultimately drives better financial outcomes and positions businesses for long-term success in an increasingly competitive landscape.
We at Devine Consulting have witnessed the transformative impact of integrating tools like Tableau into financial reporting processes. Our team of experts specializes in helping businesses leverage these advanced technologies to streamline their financial operations. If you want to enhance your financial reporting and analysis capabilities, explore our services to discover how we can help you harness the full potential of Tableau.