Power BI Finance Reports: Boost Your Business Insights

At Devine Consulting, we’ve seen firsthand how Power BI finance reports revolutionize business decision-making.
Financial data visualization has become a game-changer for companies seeking to gain a competitive edge.
Power BI transforms complex financial data into clear, actionable insights, enabling finance teams to make informed decisions quickly.
This post will guide you through creating effective Power BI finance reports and showcase essential dashboards that will boost your financial analysis capabilities.
How Power BI Revolutionizes Financial Reporting
Seamless Data Integration
Power BI excels at connecting multiple data sources. You can now pull information from your accounting software, CRM, and Excel spreadsheets into a single, cohesive dashboard. This integration eliminates hours of manual data compilation and minimizes error risks.
Real-Time Insights
Power BI puts an end to waiting for month-end reports. It provides real-time data updates, giving finance professionals immediate access to critical information. This feature enables quicker decision-making and more agile responses to market changes.
Customizable Visualizations
Power BI’s extensive library of visualizations allows finance teams to present data in the most impactful way. You can choose from traditional bar charts to complex waterfall diagrams to tell your financial story effectively. Visual data discovery software meets the demands of organizations far better than most traditional business intelligence software suites.
Simplified Advanced Analytics
Power BI incorporates machine learning capabilities, making predictive analytics accessible to finance teams (without requiring deep technical expertise). This feature allows for more accurate forecasting and trend analysis, which are key for strategic financial planning.
Mobile Accessibility
The Power BI mobile app ensures key financial metrics are always at your fingertips. This accessibility guarantees that decision-makers have the latest financial data, whether they’re in the office or on the go.
Power BI’s impact on financial reporting extends beyond time-saving. It enhances the quality and depth of financial analysis, providing businesses with a powerful tool to navigate our increasingly data-driven world. As we move forward, let’s explore the essential Power BI reports that every finance team should have in their arsenal.
Power BI Reports Every Finance Team Needs
At Devine Consulting, we’ve identified five essential Power BI reports that transform financial data into actionable insights. These reports provide a comprehensive view of your company’s financial health, enabling informed decision-making and strategic planning.
Cash Flow Analysis Dashboard
A cash flow analysis dashboard monitors your company’s liquidity. This report visualizes cash inflows and outflows, helping you predict potential cash shortages or surpluses. Key elements include:
- Daily cash balance trends
- Accounts receivable aging
- Accounts payable schedule
- Cash conversion cycle
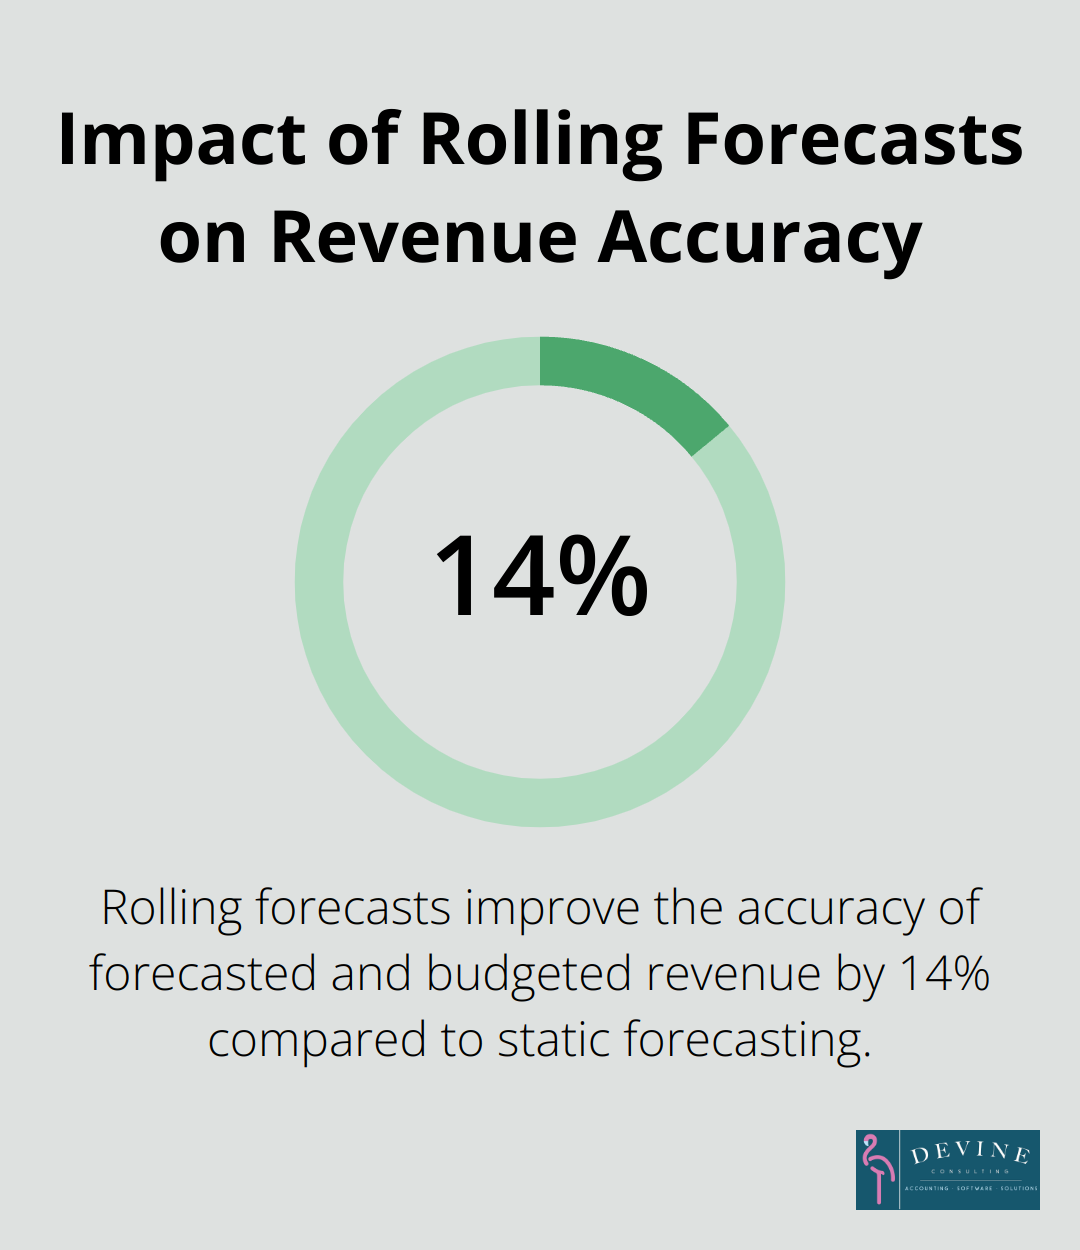
Rolling forecasts improve the accuracy of forecasted and budgeted revenue by roughly 14% when compared to static forecasting. Power BI creates dynamic cash flow forecasts that update in real-time as new data becomes available.
Profit and Loss Statement Visualization
The profit and loss (P&L) statement is a fundamental financial report. Power BI transforms this static document into an interactive visualization that allows you to:
- Compare revenue and expenses across different time periods
- Analyze profit margins by product or service line
- Identify trends in operating expenses
A survey by Deloitte found that companies using advanced analytics for financial reporting spend 20% less time on data preparation and 30% more time on analysis. This shift from data compilation to analysis can significantly improve your ability to identify profit drivers and areas for cost optimization.
Balance Sheet Overview
A Power BI balance sheet overview provides a snapshot of your company’s financial position. This report should include:
- Asset and liability breakdowns
- Working capital analysis
- Debt-to-equity ratio trends
Financial ratios derived from the balance sheet (such as the current ratio or quick ratio) can be automatically calculated and displayed in Power BI. This automation allows for real-time monitoring of your company’s financial health and early detection of potential issues.
Budget vs. Actual Comparison
Effective budget management is critical for financial success. A Power BI budget vs. actual comparison report enables you to:
- Track variances in real-time
- Drill down into specific departments or cost centers
- Forecast year-end results based on current performance
APQC’s measure calculates the number of calendar days (including weekends) it takes to complete the annual budget. Power BI’s automated reporting can significantly reduce the time spent on budget analysis, allowing for more frequent and agile budget adjustments.
Financial KPI Tracking
A financial KPI dashboard consolidates your most important metrics in one place. Essential KPIs to track include:
- Gross profit margin
- Operating profit margin
- Return on investment (ROI)
- Days sales outstanding (DSO)
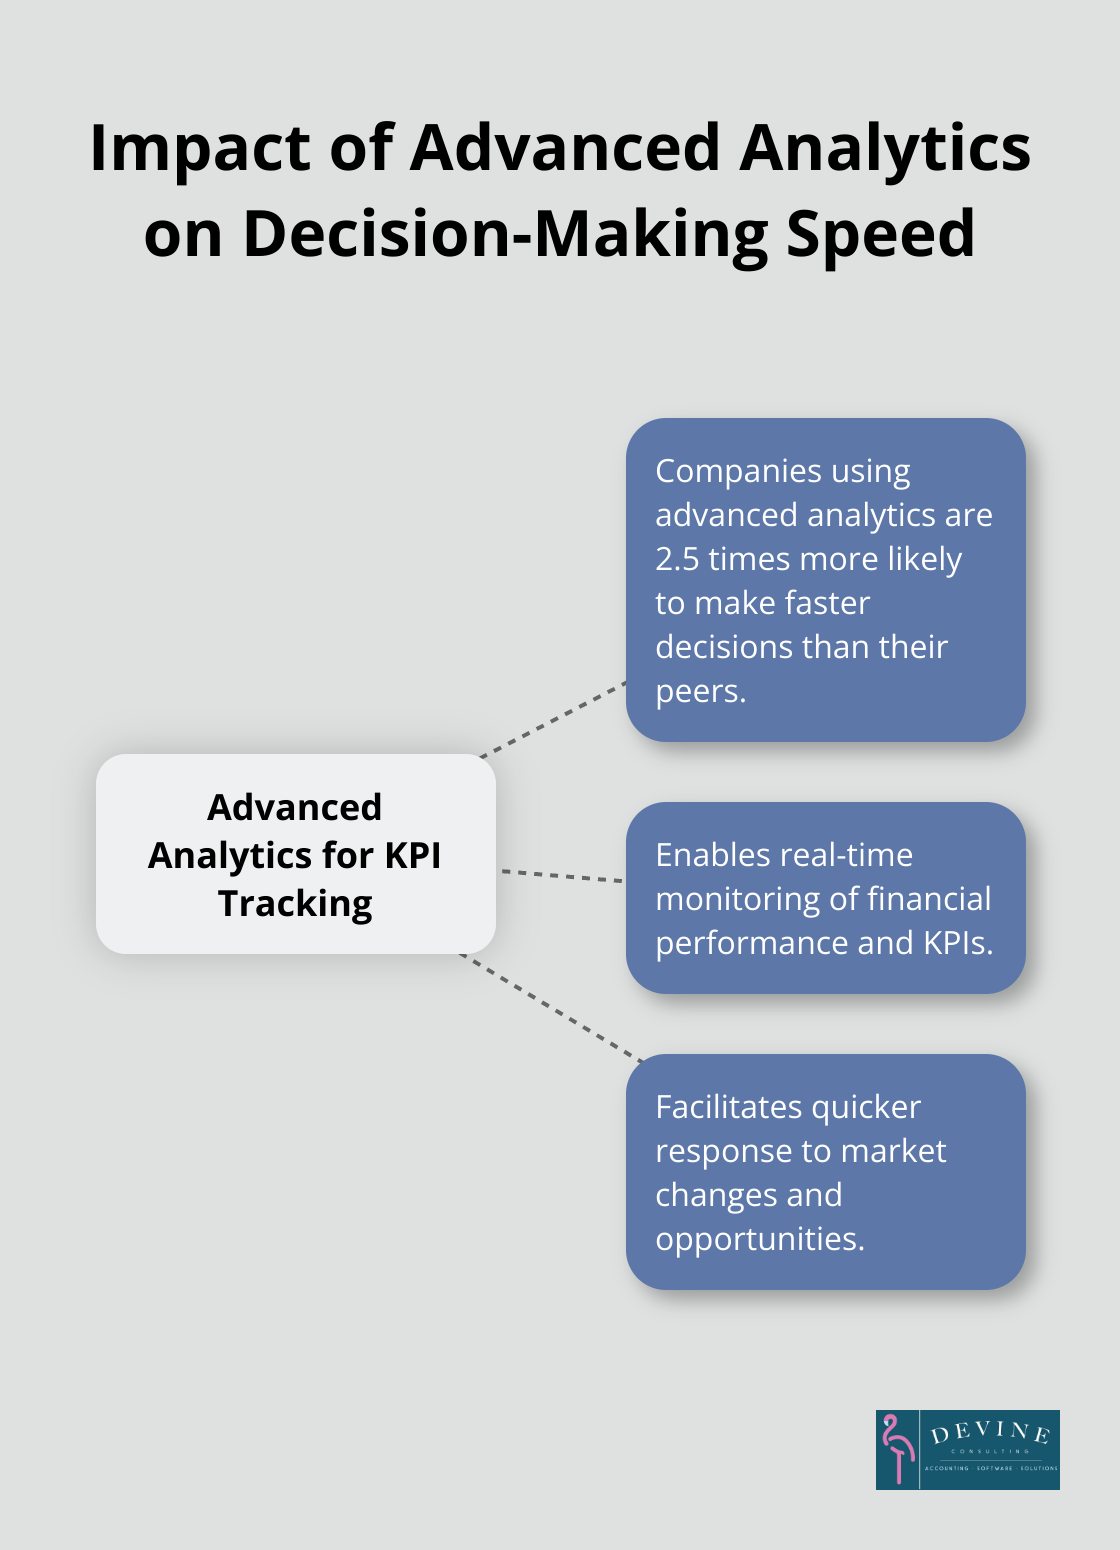
A study by McKinsey indicates that companies that use advanced analytics to track KPIs are 2.5 times more likely to make faster decisions than their peers. Power BI allows you to set up alerts for KPI thresholds, ensuring you’re always aware of significant changes in your financial performance.
These five Power BI reports form the foundation of a robust financial reporting system. Now that we’ve explored the essential reports, let’s examine how to create effective Power BI finance reports that maximize the impact of your financial data.
How to Create Powerful Power BI Finance Reports
Prioritize Data Preparation
Clean, well-structured data forms the foundation of effective Power BI finance reports. Organize your financial data meticulously before visualization. Remove duplicates, standardize formats, and ensure consistency across all data sources. This initial effort will prevent countless hours of troubleshooting later.
Design User-Centric Dashboards
When creating Power BI dashboards, prioritize the needs of your end users. Identify the key metrics they require at a glance and arrange information to tell a clear financial story. Maintain clean, uncluttered layouts. Use a consistent color scheme that aligns with your brand and helps users quickly identify different data categories.
A study by the Nielsen Norman Group revealed that users often leave web pages within 10-20 seconds. Apply this principle to dashboards by placing critical financial information front and center, allowing users to grasp key insights quickly.
Select Appropriate Visualizations
The choice of charts and graphs significantly impacts the effectiveness of financial reporting. For time-based data like revenue trends, opt for line charts or area charts. When comparing values across categories (such as expenses by department), bar charts often prove most effective. Use pie charts sparingly for showing percentages, as they can become difficult to interpret with too many segments.
Simplicity often trumps complexity in data visualization. A clear bar chart displaying month-over-month revenue can be more impactful than an intricate multi-axis visualization attempting to show too much information at once.
Implement Drill-Down Functionality
Power BI’s strength lies in its ability to provide layers of detail. Incorporate drill-down capabilities in your reports to leverage this feature. Begin with high-level financial metrics, then allow users to click through to more granular data.
For instance, a CFO might want to see overall profit margins initially, but then explore specific product lines or regions to understand the drivers behind those numbers. This layered approach enables both quick insights and deep analysis within a single report.
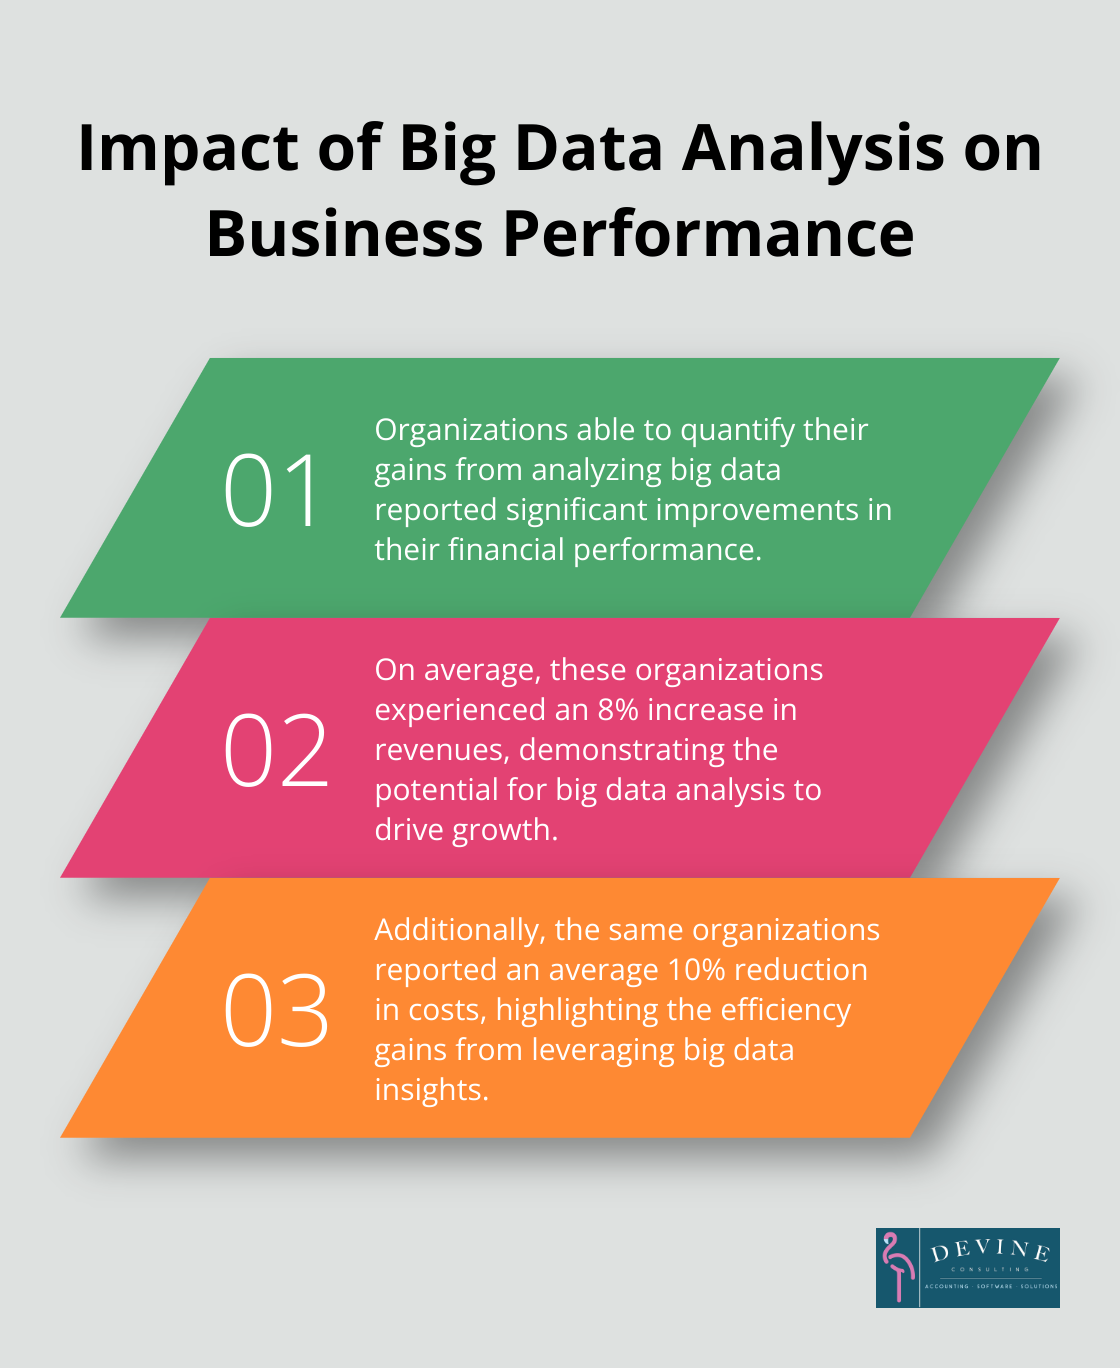
A BARC Research survey found that organizations able to quantify their gains from analyzing big data reported an average 8% increase in revenues and a 10% reduction in costs. By utilizing Power BI’s drill-down features, you create not just reports, but powerful tools for revenue growth.
Final Thoughts
Power BI has revolutionized financial reporting, transforming raw data into actionable insights that drive business success. Real-time updates, customizable visualizations, and advanced analytics enable finance teams to make faster, more informed decisions. The impact of Power BI finance reports extends beyond time-saving, enhancing the depth and quality of financial analysis.
Artificial intelligence and machine learning will further integrate into financial data visualization, automating complex analyses. This advancement will allow finance professionals to focus on strategic decision-making rather than data compilation. Power BI’s capabilities provide businesses with the financial clarity and strategic insights needed to thrive in today’s competitive landscape.
Devine Consulting can help you harness these tools effectively, ensuring your business stays ahead in financial management and strategic planning. Our comprehensive accounting solutions, combined with Power BI’s capabilities, can unlock the full potential of your financial information. Take the first step towards transforming your financial reporting today and watch your business insights soar to new heights.