How to Analyze Finance Reports Effectively

At Devine Consulting, we know that finance report analysis is a critical skill for business success. Understanding financial statements can make or break important decisions.
This blog post will guide you through the essentials of analyzing key financial reports. We’ll cover effective techniques, common pitfalls to avoid, and why a holistic approach matters.
What Are the Key Financial Reports?
Financial reports form the foundation of business decision-making. Let’s examine the three main financial statements you need to understand.
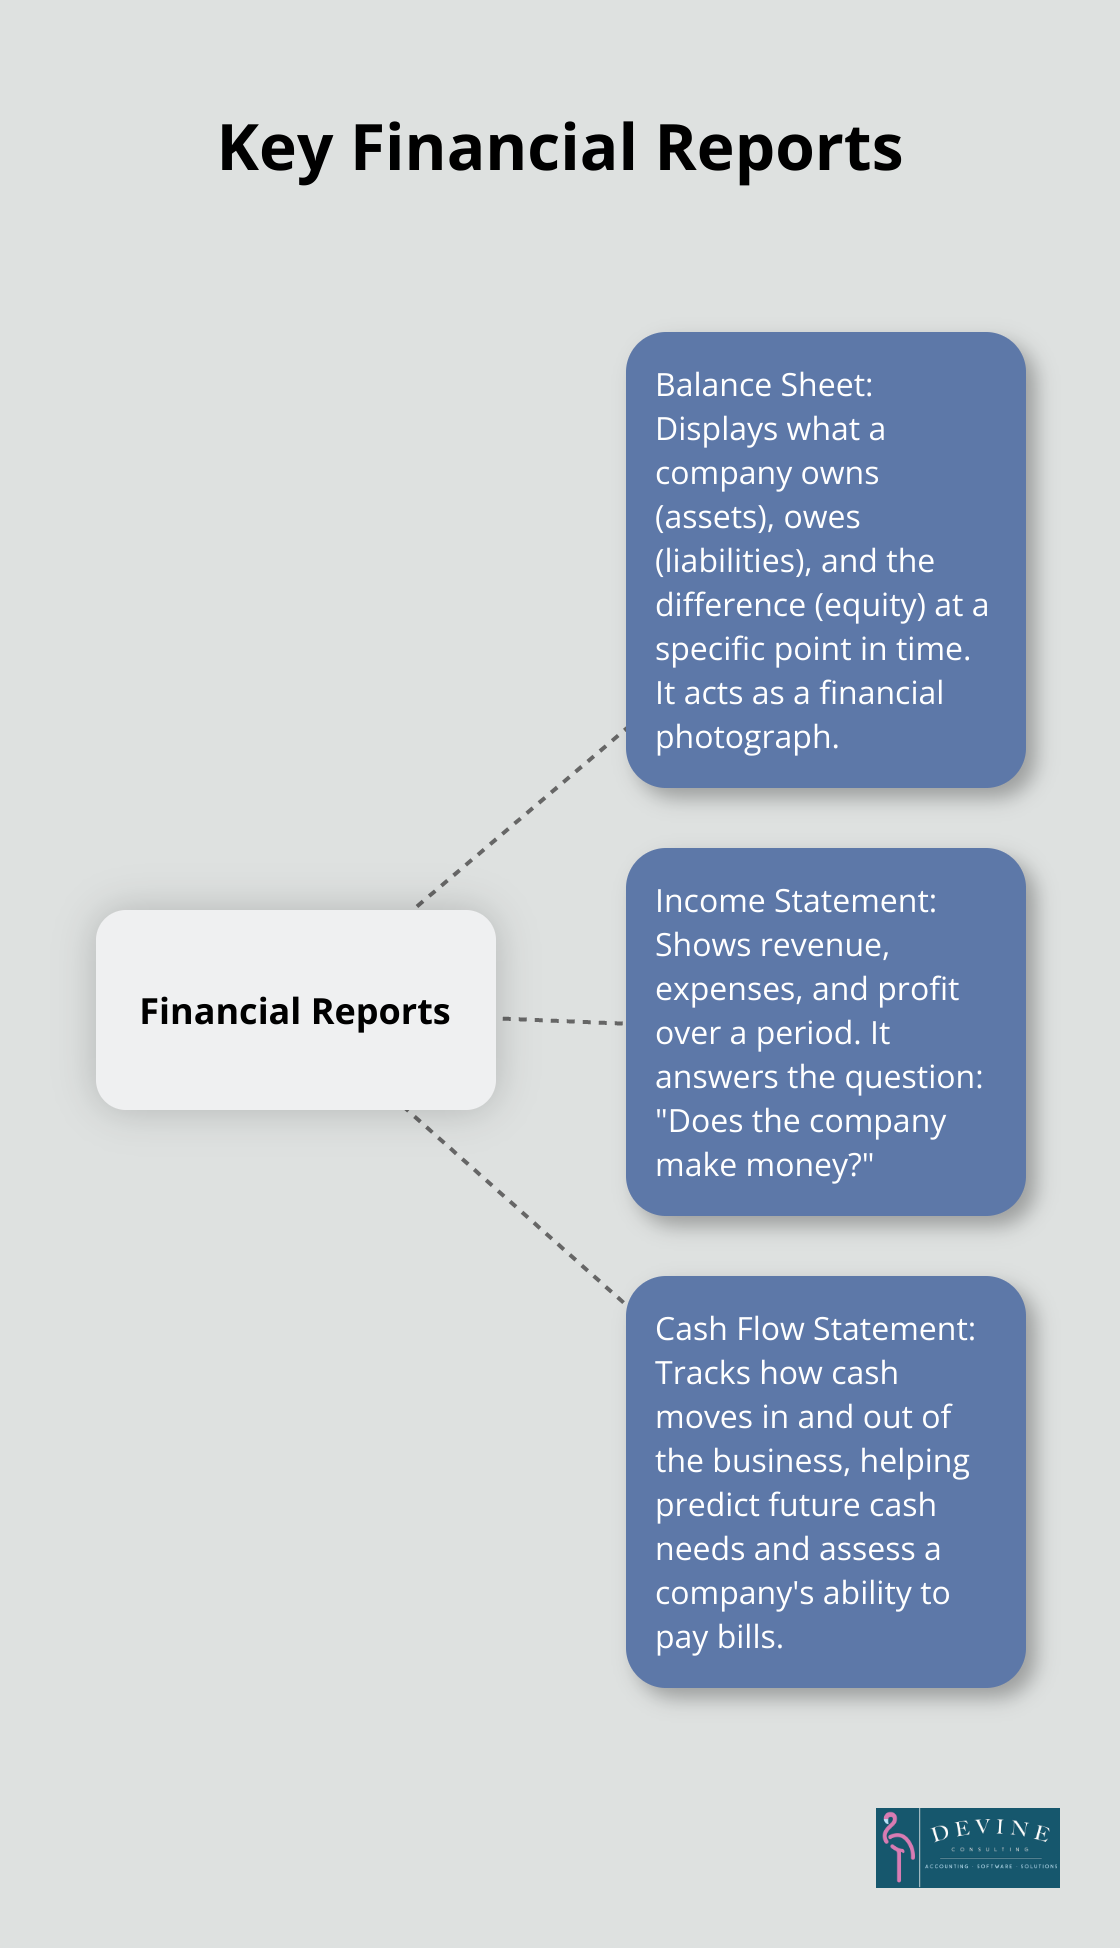
The Balance Sheet: A Snapshot of Financial Position
The balance sheet displays what a company owns (assets), owes (liabilities), and the difference between the two (equity) at a specific point in time. It acts as a financial photograph.
Assets include cash, inventory, and equipment. Liabilities cover debts and obligations. Equity represents the owners’ stake in the business. A healthy balance sheet typically shows more assets than liabilities.
Pro tip: Always check the cash position. A company with high profits but low cash can still fail.
The Income Statement: Profitability Over Time
The income statement (also known as the profit and loss statement) shows revenue, expenses, and profit over a period. It answers the question: “Does the company make money?”
Revenue is the top line, showing total sales. Expenses are subtracted from revenue to calculate profit. The bottom line is net income – what remains after all expenses are paid.
Poor cash flow management may lead to delayed salary payments, causing frustration and demotivation among the workforce. This can result in significant business challenges.
The Cash Flow Statement: Following the Money
The cash flow statement tracks how cash moves in and out of the business. It consists of three sections:
- Operating activities: Cash from core business operations
- Investing activities: Cash used for long-term investments
- Financing activities: Cash from loans, stock issuances, or dividends
This statement helps predict future cash needs and assess a company’s ability to pay bills.
Cash flow forecasting is crucial for midsize businesses to implement best practices and avoid risks.
Interpreting Financial Reports: A Holistic Approach
While each financial report provides valuable insights, they work together to paint a complete picture of a company’s financial health. For example, a company might show strong profits on the income statement but struggle with cash flow, as revealed by the cash flow statement.
Understanding the interplay between these reports allows for more informed decision-making. It enables businesses to identify potential issues early and capitalize on growth opportunities.
As we move forward, we’ll explore effective techniques for analyzing these financial reports, helping you extract maximum value from this critical financial data.
How to Extract Insights from Financial Data
Ratio Analysis: The Key to Financial Health
Ratio analysis is a method of examining a company’s balance sheet and income statement to learn about its liquidity, operational efficiency, and profitability. It compares different figures from financial statements to gain insights into a company’s performance. Here are some key ratios to focus on:
- Current Ratio: This liquidity ratio (current assets / current liabilities) should exceed 1, indicating the company can cover its short-term obligations.
- Debt-to-Equity Ratio: This solvency ratio (total liabilities / shareholders’ equity) assesses financial leverage. A ratio below 2 is generally considered healthy for most industries.
- Gross Profit Margin: This profitability ratio ((revenue – cost of goods sold) / revenue) shows how efficiently a company uses its resources. Higher margins often indicate better efficiency.
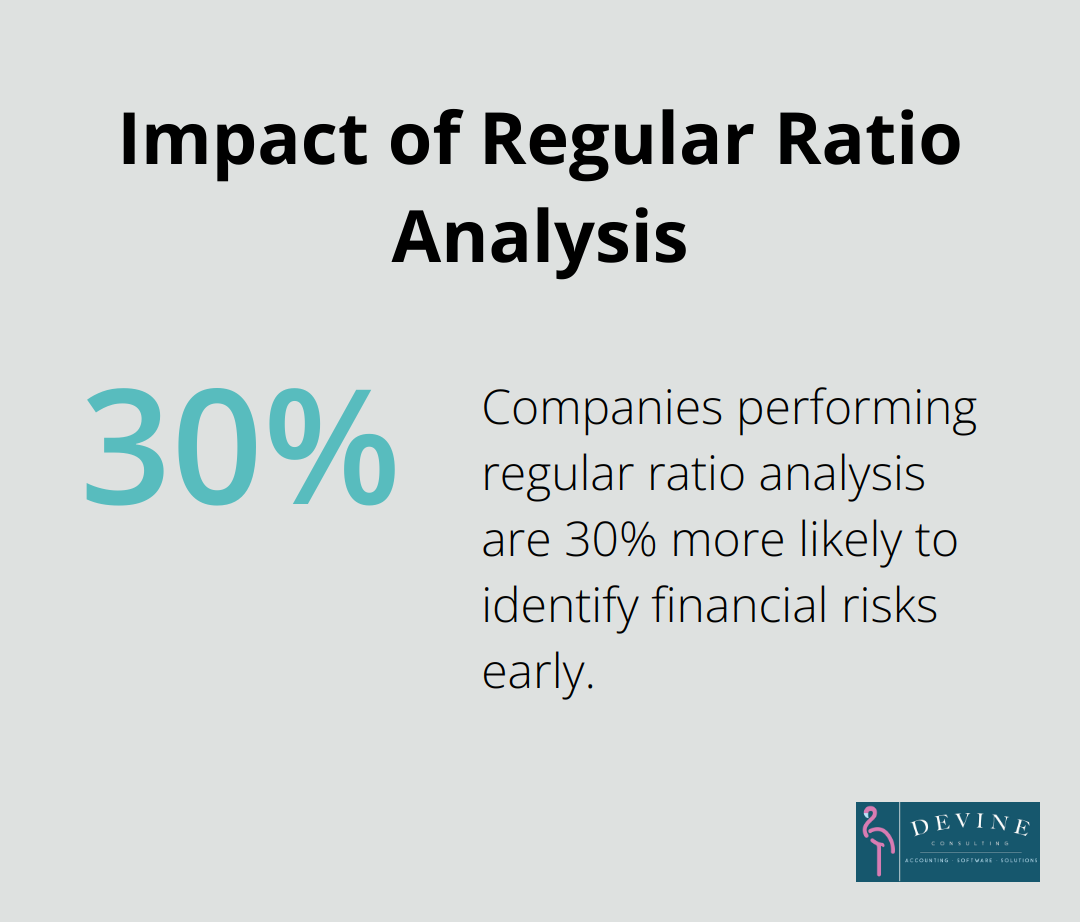
A study by KPMG found that companies which regularly perform ratio analysis are 30% more likely to identify financial risks early.
Trend Analysis: Spotting Patterns Over Time
Trend analysis examines financial data over multiple periods to identify patterns. This technique is essential for forecasting and strategic planning. Here’s how to approach it:
- Plot key financial metrics (revenue, net income, cash flow) on a graph over several years.
- Look for consistent upward or downward trends. If revenue grows but profit declines, it might indicate rising costs or inefficiencies.
- Pay attention to seasonal patterns, especially in industries like retail or tourism.
AI-driven operations forecasting is proving essential for better forecasting in operations management, even in data-light environments.
Comparative Analysis: Benchmarking Against Peers
Comparative analysis benchmarks a company’s financial performance against industry peers or competitors. This provides context and helps identify areas for improvement. Here’s an effective approach:
- Identify 3-5 similar companies in terms of size, industry, and market.
- Compare key financial ratios and metrics.
- Look for significant differences and investigate the reasons behind them.
For example, if your inventory turnover ratio is lower than the industry average, it might indicate inefficient inventory management.
A study by Deloitte revealed that companies who regularly benchmark against competitors are 20% more likely to achieve above-average financial performance in their industry.
These techniques help businesses gain a deeper understanding of their financial position, identify potential issues, and make data-driven decisions. Effective financial analysis tells the story behind the numbers and uses that story to drive business success. However, even with these powerful tools, financial analysis can still present challenges. In the next section, we’ll explore common pitfalls to avoid when analyzing financial reports.
What Are Common Pitfalls in Financial Report Analysis?
Financial report analysis presents several challenges, even for experienced professionals. We at Devine Consulting have observed businesses make costly errors when interpreting financial data. This chapter highlights some common pitfalls to avoid:
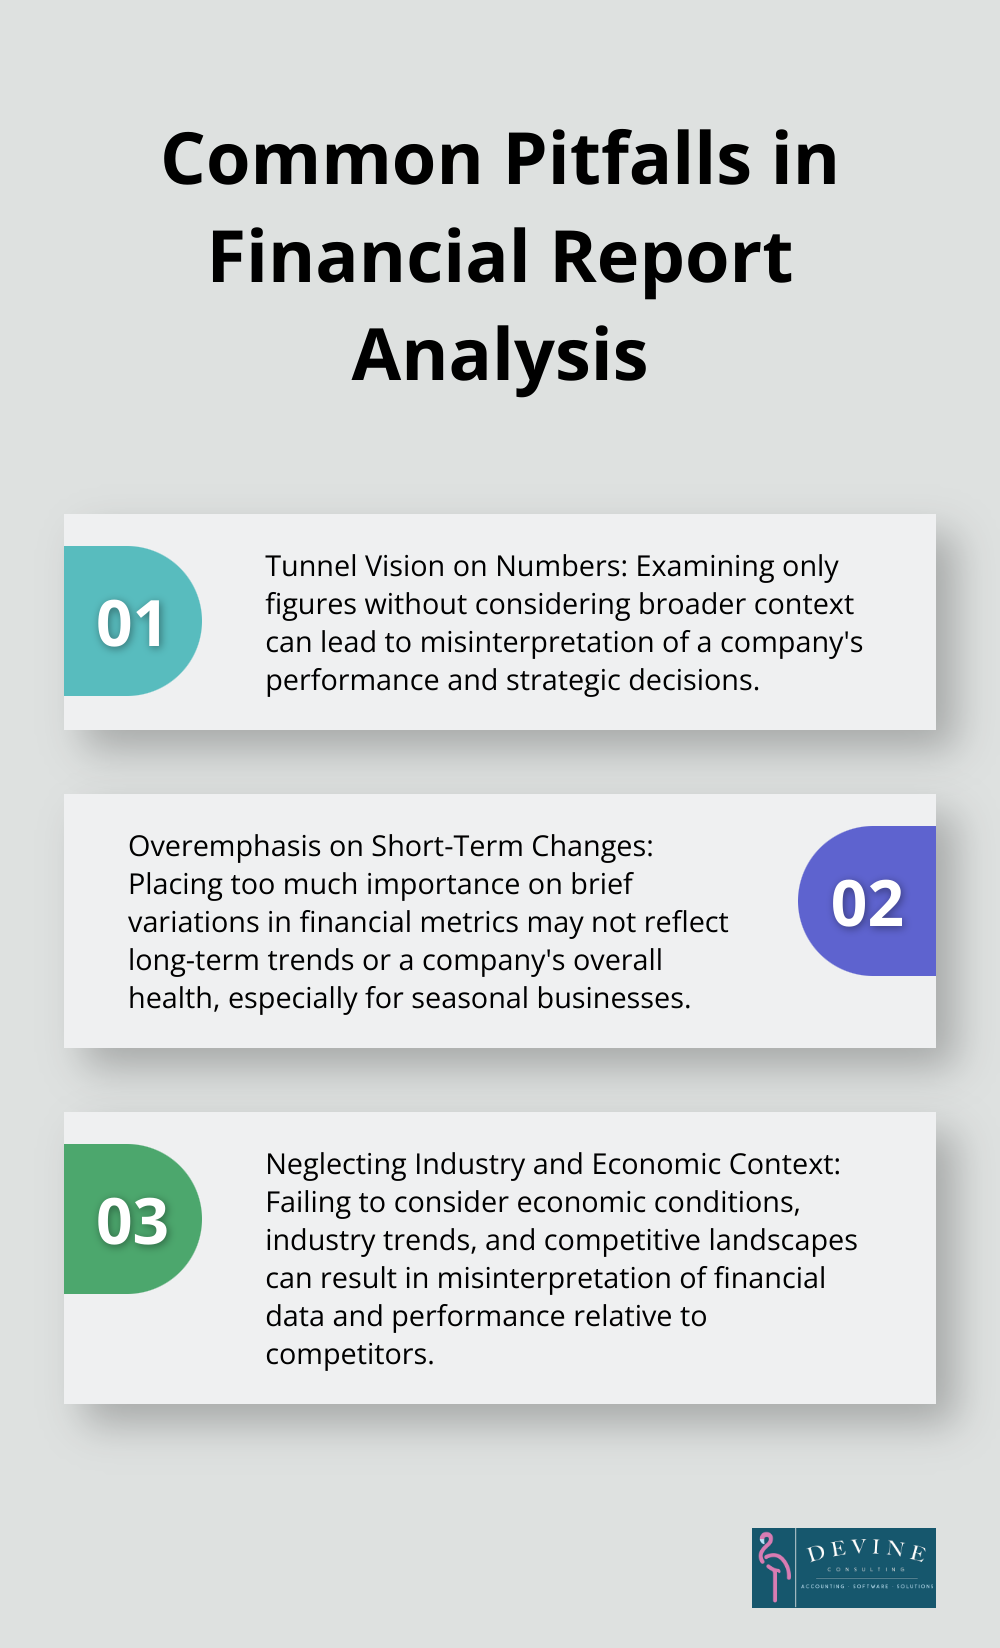
Tunnel Vision on Numbers
Financial reports tell a story about a company’s operations, market position, and strategic decisions. Many analysts err by examining only the figures without considering the broader context.
A sudden profit decrease doesn’t always indicate poor performance. It could result from strategic investments in new technology or market expansion. These non-financial factors can significantly impact financial results.
Companies also use nonfinancial performance measures, such as product quality, workplace safety, customer loyalty, employee satisfaction, and other metrics to gain a more comprehensive view of their performance.
Overemphasis on Short-Term Changes
Another frequent mistake involves placing too much importance on short-term changes in financial metrics. Markets inherently fluctuate, and brief variations don’t always reflect long-term trends or a company’s overall health.
Seasonal businesses (such as retail or tourism) often display significant variations in quarterly reports. Overreacting to these expected fluctuations can lead to poor decision-making.
Analysts should examine trends over several quarters or years to obtain a more accurate picture of a company’s financial trajectory.
Neglecting Industry and Economic Context
No business operates in isolation. Economic conditions, industry trends, and competitive landscapes all influence a company’s financial performance. Failure to consider these factors can result in misinterpretation of financial data.
During an economic downturn, a slight profit decrease might actually represent strong performance if competitors experience more significant losses.
The Global Competitiveness Report published by the World Economic Forum provides valuable insights into the economic context and competitiveness of various countries and industries.
Misinterpreting Ratios and Metrics
Financial ratios provide valuable insights, but their misinterpretation can lead to flawed conclusions. For example, a high current ratio (indicating strong liquidity) might seem positive, but it could also suggest inefficient use of assets.
Try to understand the context behind each ratio and how it relates to the company’s overall strategy and industry norms.
Overlooking Cash Flow
While profit figures often grab headlines, cash flow remains the lifeblood of any business. Companies can show strong profits on paper but still face cash flow problems that threaten their survival.
Always analyze the cash flow statement alongside the income statement and balance sheet. This approach provides a more comprehensive view of a company’s financial health.
Streamlining accounting processes can help avoid many of these pitfalls and improve the accuracy of financial report analysis.
Final Thoughts
Finance report analysis empowers businesses to make informed decisions that drive growth and profitability. The balance sheet, income statement, and cash flow statement provide a comprehensive view of a company’s financial health. Effective analysis techniques include ratio analysis, trend analysis, and comparative analysis (which benchmarks performance against industry peers).
A holistic approach to financial interpretation considers both quantitative and qualitative factors. This approach uncovers valuable insights that drive strategic planning and operational improvements. Companies that master finance report analysis gain a competitive edge in today’s fast-paced business environment.
Devine Consulting offers comprehensive accounting solutions to help businesses achieve financial stability and growth. Our expertise ensures accurate analysis and interpretation of your financial data. We provide the insights you need to make informed decisions and plan for the future.