How to Create a Simple Finance Report
Creating a simple finance report can be a game-changer for businesses of all sizes. At Devine Consulting, we’ve seen firsthand how clear financial insights drive better decision-making.
This guide will walk you through the essential steps to craft an effective simple finance report. We’ll cover everything from understanding the basics to presenting your data in a compelling way.
Why Finance Reports Are Essential
The Power of Financial Insights
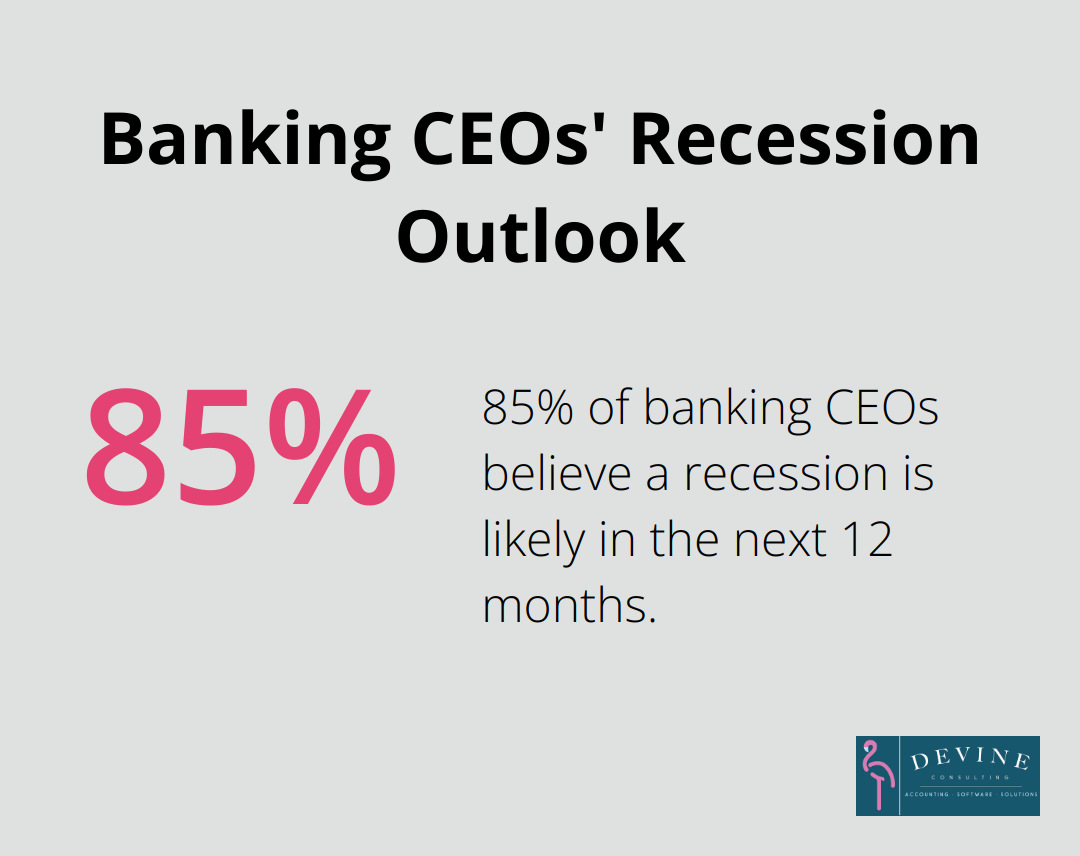
Finance reports serve as the GPS for your business, guiding you through the complex terrain of financial management. They provide a clear snapshot of your company’s financial health, highlighting areas of strength and pinpointing opportunities for improvement. A study by KPMG found that 85 percent of banking CEOs believe a recession is likely in the next 12 months, emphasizing the importance of financial data in strategic decision-making.
Key Elements of an Effective Finance Report
An impactful finance report doesn’t need to be overly complex. Focus on including these essential components:
- Income Statement: This shows your revenue, expenses, and profit over a specific period.
- Balance Sheet: A snapshot of your assets, liabilities, and equity at a given point in time.
- Cash Flow Statement: This tracks the inflow and outflow of cash in your business.
A recent survey revealed that firms are reporting 17% growth, highlighting the importance of regularly reviewing financial statements for better decision-making.
Tailoring Your Report to Your Audience
One size doesn’t fit all when it comes to finance reports. The needs of a CFO differ greatly from those of a department manager or an external investor. You should tailor your report to your audience’s financial literacy and specific interests. For example, a sales manager might focus more on revenue trends and customer acquisition costs, while a board member might prioritize overall profitability and return on investment.
The Impact of Regular Reporting
Regular financial reporting can transform your business operations. Companies that implement consistent reporting practices often see:
- Improved decision-making (based on real-time data)
- Enhanced ability to spot trends and patterns
- Better resource allocation
- Increased stakeholder confidence
Leveraging Technology for Efficient Reporting
Modern accounting software has revolutionized the way businesses create and analyze financial reports. These tools can:
- Automate data collection and report generation
- Provide real-time updates and insights
- Offer customizable templates for different reporting needs
- Integrate with other business systems for comprehensive analysis
(Devine Consulting offers expertise in implementing and optimizing these technological solutions for businesses across various industries.)
As we move forward, let’s explore the process of gathering and organizing the financial data that will form the backbone of your reports.
Where Does Your Financial Data Come From?
Primary Sources of Financial Information
Your financial data originates from various sources within your organization. Your accounting software often serves as the main reservoir, storing transaction details, invoices, and payment records. However, other important sources include:
- Point-of-sale systems: These capture real-time sales data.
- Payroll systems: They provide essential information on labor costs.
- Inventory management tools: These offer insights into cost of goods sold.
- Customer relationship management (CRM) software: It can reveal sales trends and customer acquisition costs.
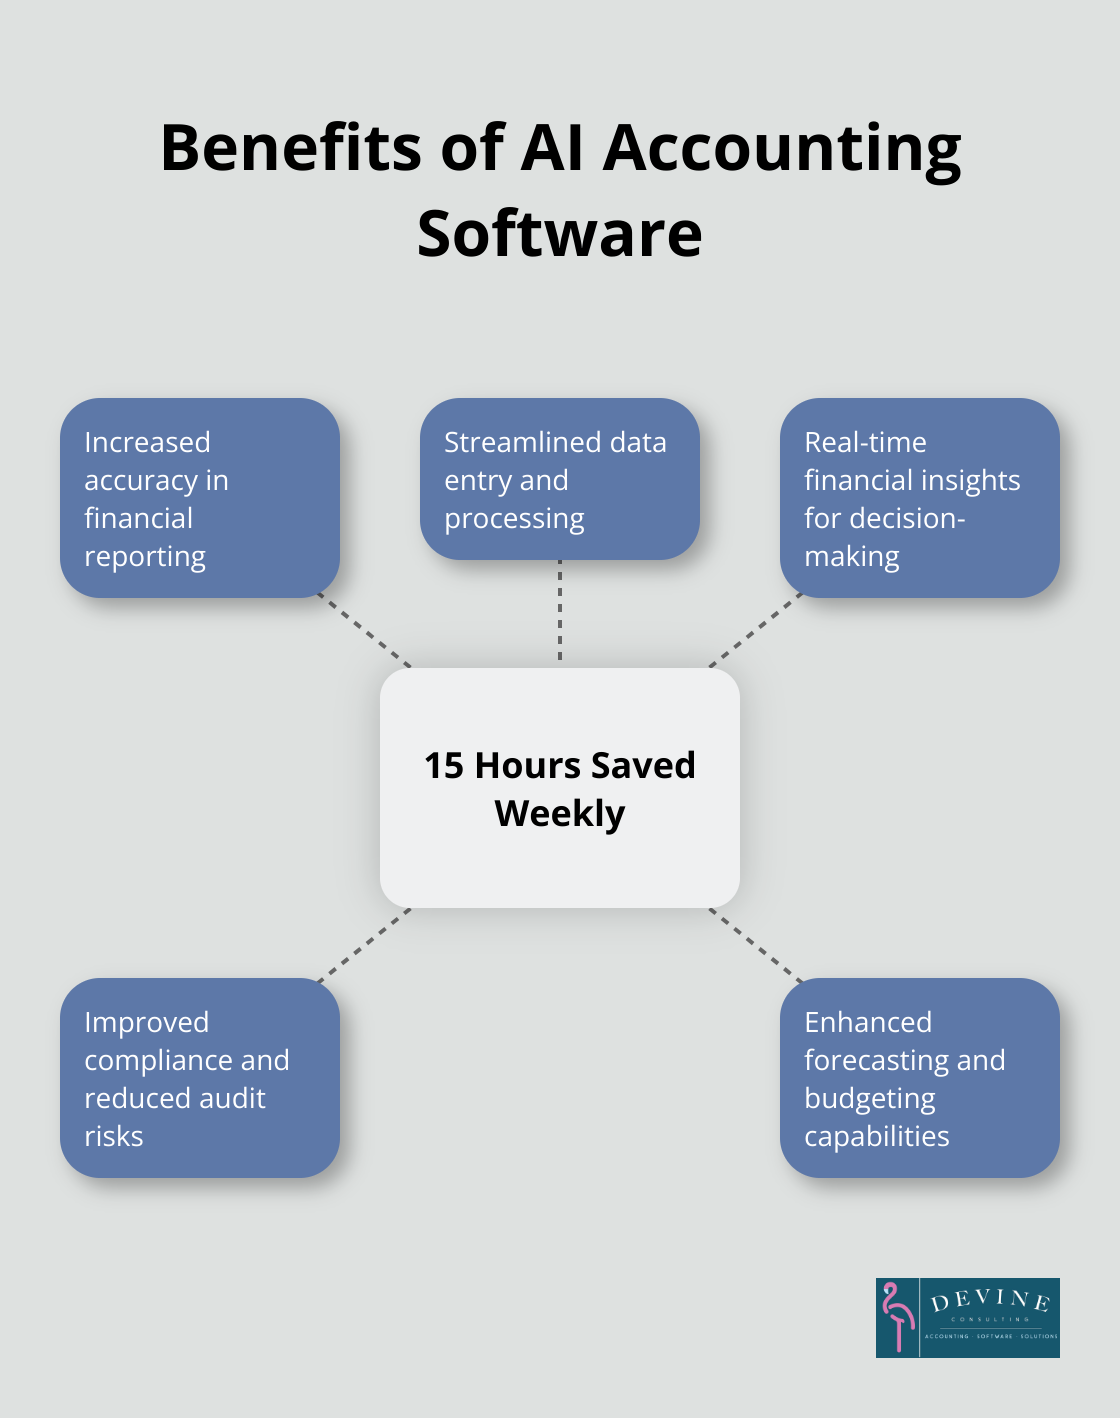
Integrated financial solutions streamline operations, improve accuracy, and drive better decision-making. According to a 2023 Sage study, businesses using AI accounting software save an average of 15 hours per week on financial tasks.
Maintaining Data Accuracy and Consistency
The quality of your finance report depends on the accuracy of your data. Here are strategies to maintain data integrity:
- Regular reconciliation processes: A survey by BlackLine revealed that 55% of C-suite executives and finance professionals lack full confidence in their ability to identify financial errors before reporting results.
- Standardized data entry procedures: This reduces the risk of inconsistencies and errors.
- Staff training: Everyone involved in data entry should understand the importance of accuracy and follow established protocols.
- Automation: Automated data entry can significantly reduce human error.
Selecting Relevant Financial Metrics
While comprehensive data is important, focusing on the right metrics is essential. Key performance indicators (KPIs) vary by industry and business model, but some universally important metrics include:
- Gross Profit Margin: This shows the percentage of revenue that exceeds the cost of goods sold.
- Net Profit Margin: A measure of how much profit is generated as a percentage of revenue.
- Current Ratio: This liquidity metric indicates a company’s ability to pay short-term obligations.
- Accounts Receivable Turnover: This shows how efficiently a company collects payments.
- Customer Acquisition Cost (CAC): This is particularly important for service-based and subscription businesses.
The goal is not to overwhelm yourself with data, but to uncover insights that drive decision-making.
Incorporating External Data
While internal data forms the core of your finance report, external data provides valuable context. Industry benchmarks, economic indicators, and market trends help you interpret your financial performance in a broader context. Sources like the Bureau of Labor Statistics, industry associations, and market research firms provide this valuable external perspective.
Now that we’ve explored the sources and quality of financial data, let’s move on to the next crucial step: creating a finance report that effectively communicates your financial story.
How to Build a Clear and Compelling Finance Report
Choose a User-Friendly Format
The layout of your finance report can significantly impact its effectiveness. Select a clean, uncluttered design that guides the reader through the information. Users typically read only 20% of the text on a page (according to a Nielsen Norman Group study), so make every word count.
Start with an executive summary that highlights key findings. Follow this with detailed sections for each financial statement. Use consistent formatting throughout, including font sizes and styles, to maintain a professional look.
Harness the Power of Visuals
Graphs and charts effectively convey complex financial data quickly. People remember visual information 55% more accurately than text alone (as found by a University of Minnesota study).
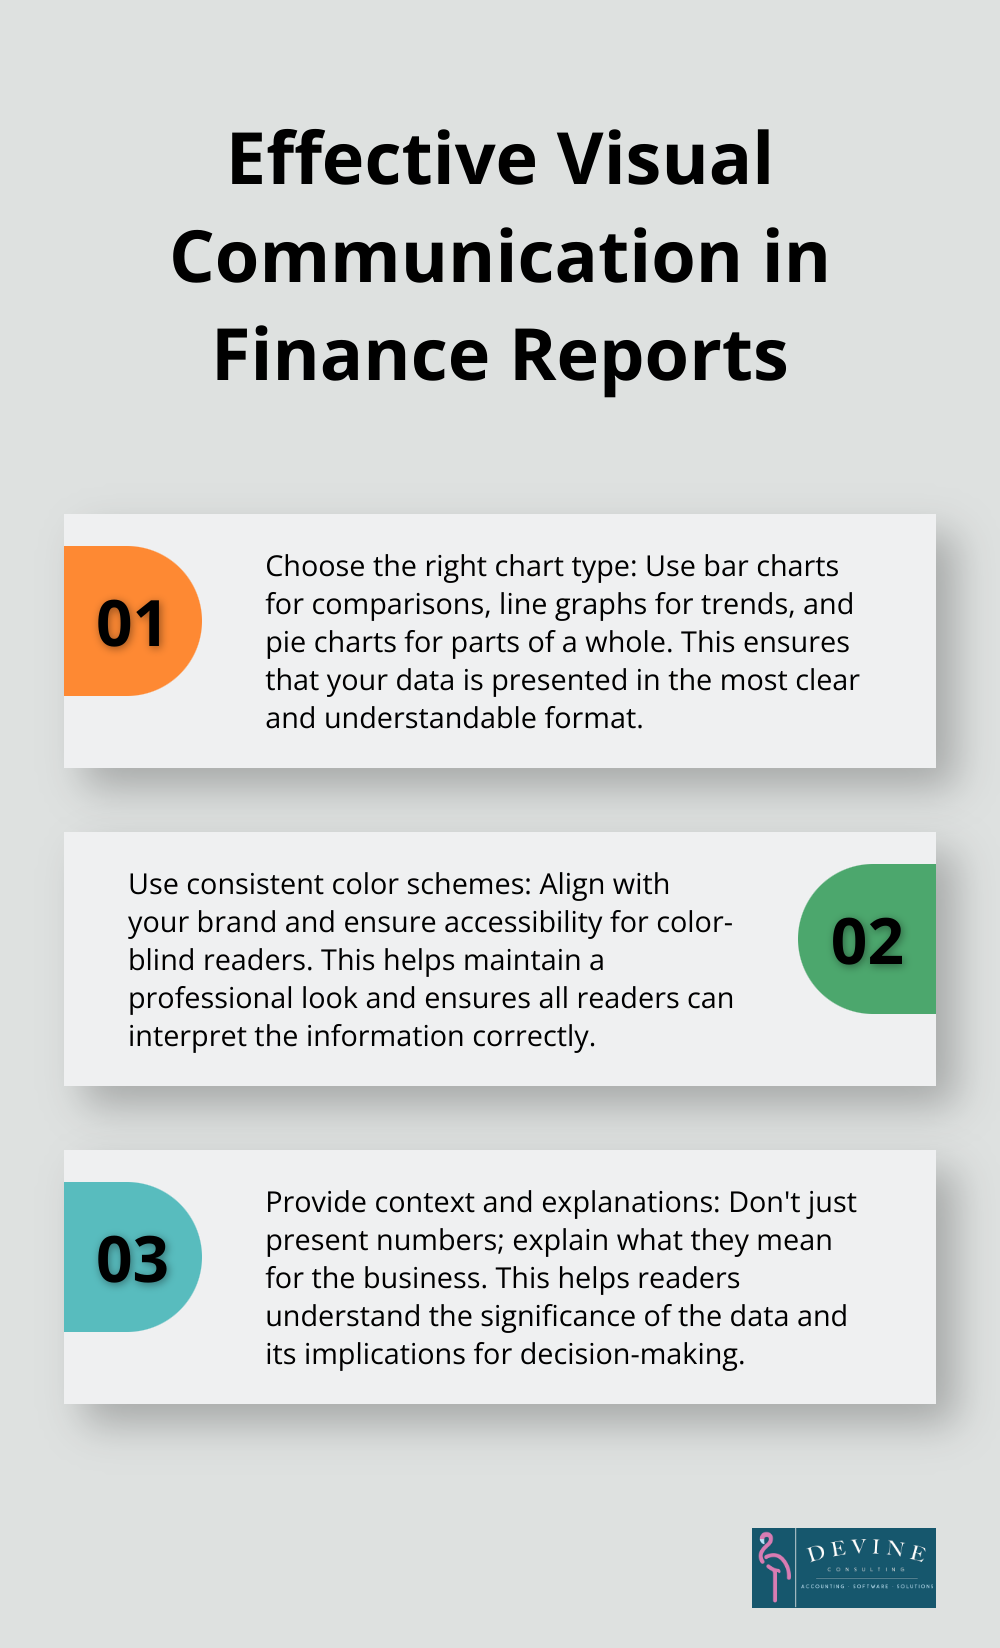
Select the right chart type for your data:
- Bar charts for comparing categories
- Line graphs for showing trends over time
- Pie charts for displaying parts of a whole
Color plays a crucial role. Use a consistent color scheme that aligns with your brand, but ensure it’s accessible for color-blind readers. (Tools like Adobe Color can help create color-blind safe palettes.)
Write with Clarity and Precision
Financial jargon can obstruct understanding. Write explanations that a non-financial person can grasp. The Securities and Exchange Commission (SEC) recommends using plain English in financial documents to improve comprehension.
Use specific language. Instead of “sales increased significantly,” state “sales grew by 15% compared to last quarter.” This precision builds trust and credibility with your readers.
Provide context. Don’t just present numbers; explain what they mean for the business. For example, if expenses have risen, explain whether this results from expansion efforts or market pressures.
Tailor Your Report to Your Audience
Different stakeholders require different levels of detail. A CFO might want in-depth analysis, while a department manager might need a high-level overview. Customize your report to meet the specific needs of your audience.
Try to anticipate questions your readers might have and address them proactively. This approach demonstrates thoroughness and saves time in follow-up discussions.
Incorporate Benchmarks and Trends
Include industry benchmarks and historical trends to provide context for your financial data. This comparison helps readers understand how the company performs relative to competitors and its own past performance.
(If you need assistance in gathering industry-specific benchmarks or creating tailored financial reports, Devine Consulting offers expertise across various sectors.)
Final Thoughts
A simple finance report empowers businesses to make informed decisions. You can transform raw numbers into actionable insights by understanding the basics, gathering accurate data, and presenting it effectively. Regular financial reporting helps you spot trends, identify potential issues early, and capitalize on growth opportunities in today’s fast-paced business environment.
We at Devine Consulting understand the challenges of creating effective financial reports. Our team of experts can help streamline your financial reporting process, ensuring you have the insights you need to drive your business forward. We offer comprehensive accounting solutions tailored to various industries, including construction, oil and gas, and real estate.
Devine Consulting can handle your financial management needs while you focus on your core operations. We provide accurate bookkeeping, strategic financial planning, and the support you need to achieve financial stability and growth. Our full-service approach saves you time and money, and provides trusted strategic support for future planning.
