How to Create an Effective Finance Management Report

Finance management reports are the backbone of informed decision-making in any organization. These reports provide a comprehensive view of a company’s financial health, performance, and future prospects.
At Devine Consulting, we’ve seen firsthand how well-crafted finance management reports can drive strategic planning and operational efficiency. This blog post will guide you through the essential components and best practices for creating effective financial reports that resonate with various stakeholders.
What Makes a Finance Management Report Effective?
A finance management report is more than just a collection of numbers. It’s a strategic tool that provides a clear picture of your company’s financial health. An effective report drives action and informs decision-making.
The Power of the Income Statement
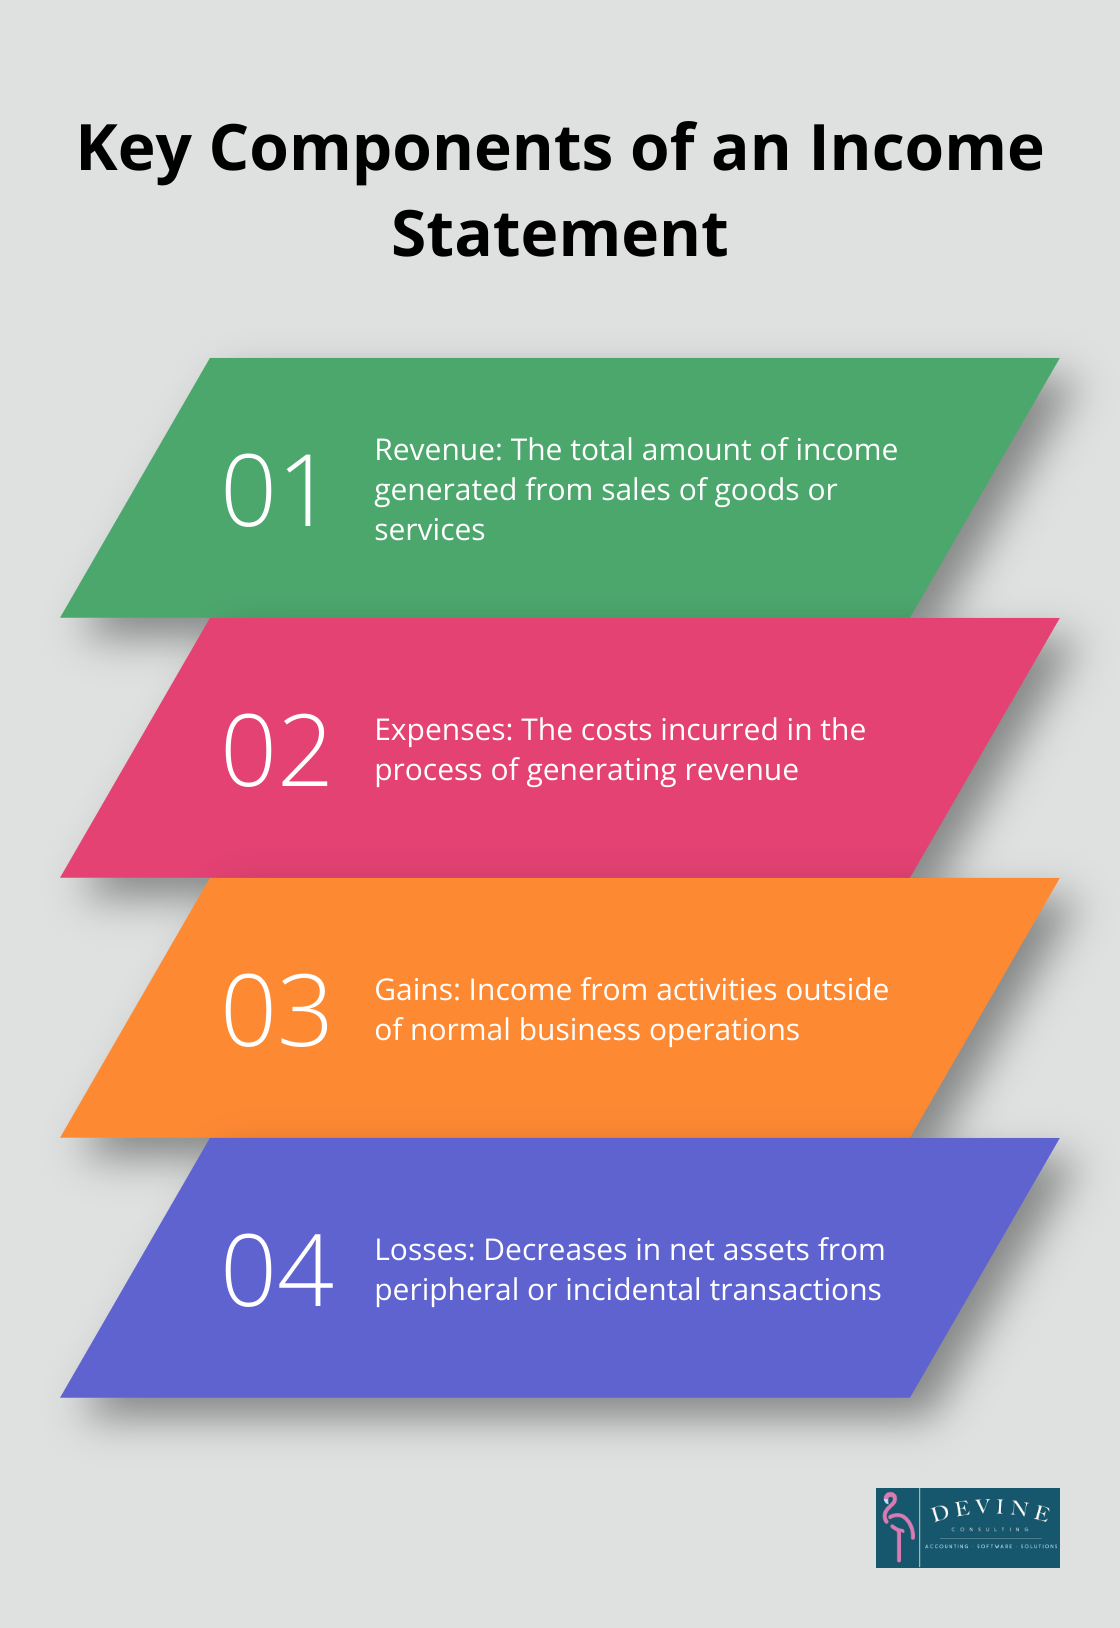
The income statement is a crucial component of financial reporting. It requires reporting four key items: revenue, expenses, gains, and losses. This statement provides insights into a company’s profitability and performance over a specific period.
Balancing Act: The Balance Sheet
Your balance sheet provides a snapshot of your company’s financial position at a specific point in time. It lists assets, liabilities, and equity. The current ratio (current assets divided by current liabilities) is a critical indicator to gauge short-term financial health. A ratio below 1 might indicate potential cash flow issues.
Cash is King: The Cash Flow Statement
The cash flow statement reports a company’s sources and use of cash over a certain period of time. It categorizes cash flows into operations, investing, and financing activities. This statement is essential for understanding your company’s liquidity and cash management.
KPIs: The Pulse of Your Business
Key Performance Indicators (KPIs) are the vital signs of your financial health. Choose KPIs that align with your industry and business goals. For example, a SaaS company might focus on Monthly Recurring Revenue (MRR) and Customer Acquisition Cost (CAC), while a retailer might prioritize inventory turnover and gross margin return on investment (GMROI).
Telling Your Financial Story
The most effective finance management reports don’t just present data – they tell a story. They highlight trends, flag potential issues, and suggest areas for improvement. Try to tailor these key components to your specific business needs. This approach will create a report that’s not just informative, but actionable.
As we move forward, let’s explore how to present this financial data in a clear and engaging manner that resonates with various stakeholders.
How to Present Financial Data Effectively
Simplify Complex Information
Financial jargon often creates barriers to understanding. We use plain language that’s accessible to all stakeholders, not just financial experts. For example, instead of “accounts receivable turnover,” we say “how quickly customers pay their bills.” This approach ensures that everyone (from the CEO to department managers) can grasp the financial situation quickly.
Leverage Data Visualization
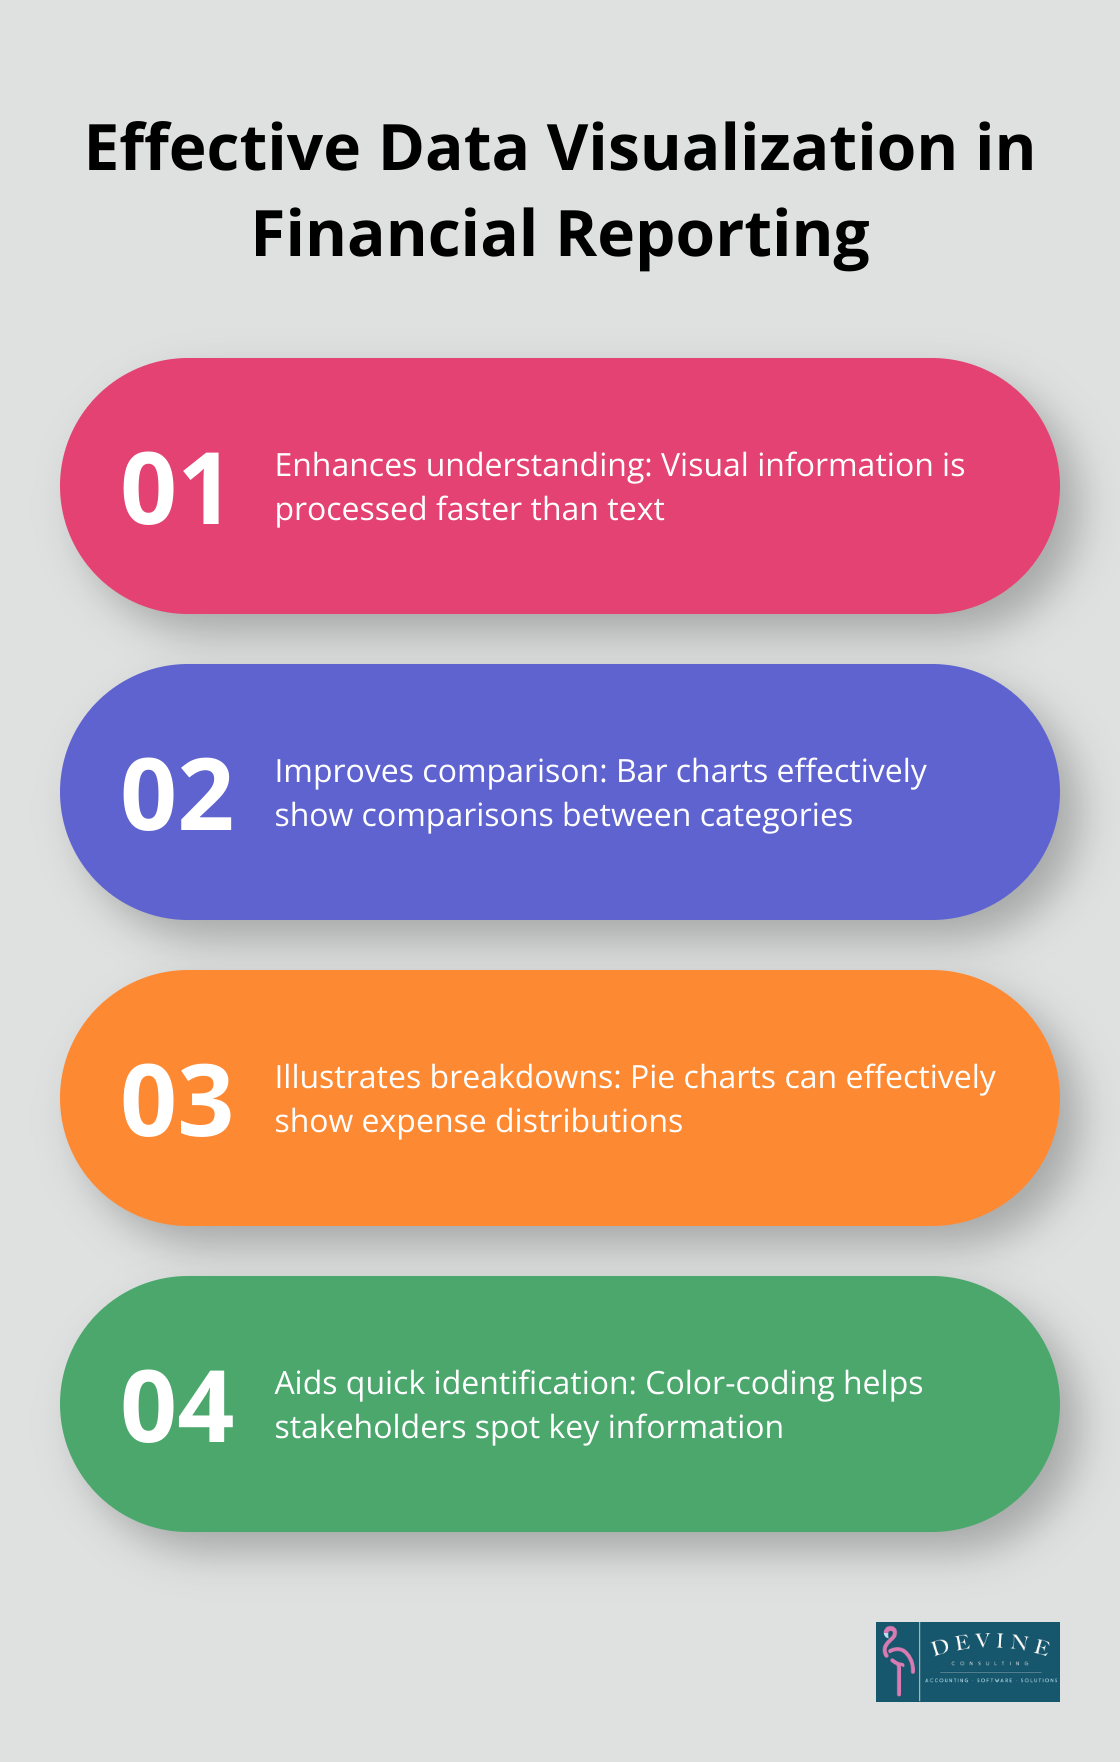
Humans process visual information faster than text. Charts, graphs, and infographics enhance our reports. Bar charts can instantly show comparisons between categories, while pie charts can effectively illustrate expense breakdowns. Color-coding and consistent design elements across reports help stakeholders quickly identify key information.
Contextualize Your Data
Numbers in isolation don’t tell the full story. We provide context by including industry benchmarks, historical data, and future projections. For instance, if a company’s profit margin is 15%, we might note that the industry average is 12% (immediately highlighting the company’s strong performance). This context helps stakeholders understand not just where the company stands, but how it compares to competitors and its own past performance.
Highlight Key Trends and Patterns
Identifying trends is essential for strategic planning. We use techniques like year-over-year comparisons and moving averages to spot patterns in financial data. For example, we might highlight that while overall revenue has increased, profit margins have slowly declined over the past three quarters. This insight can prompt further investigation into cost structures or pricing strategies.
Tailor Reports to Your Audience
Different stakeholders require different levels of detail. Executives might need high-level summaries, while department heads might require more granular data. We customize our reports to meet the specific needs of each audience, ensuring that everyone receives the information most relevant to their role and decision-making responsibilities.
The goal of a finance management report is to provide actionable insights, not just present data. These practices create reports that drive informed decision-making and contribute to a company’s financial success. In the next section, we’ll explore how to tailor these reports for different stakeholders within an organization.
How to Tailor Finance Reports for Different Stakeholders
At Devine Consulting, we understand that finance management reports must cater to various audiences. Different stakeholders require unique approaches to financial reporting. Here’s how we customize reports for different groups:
C-Level Executives: High-Level Insights
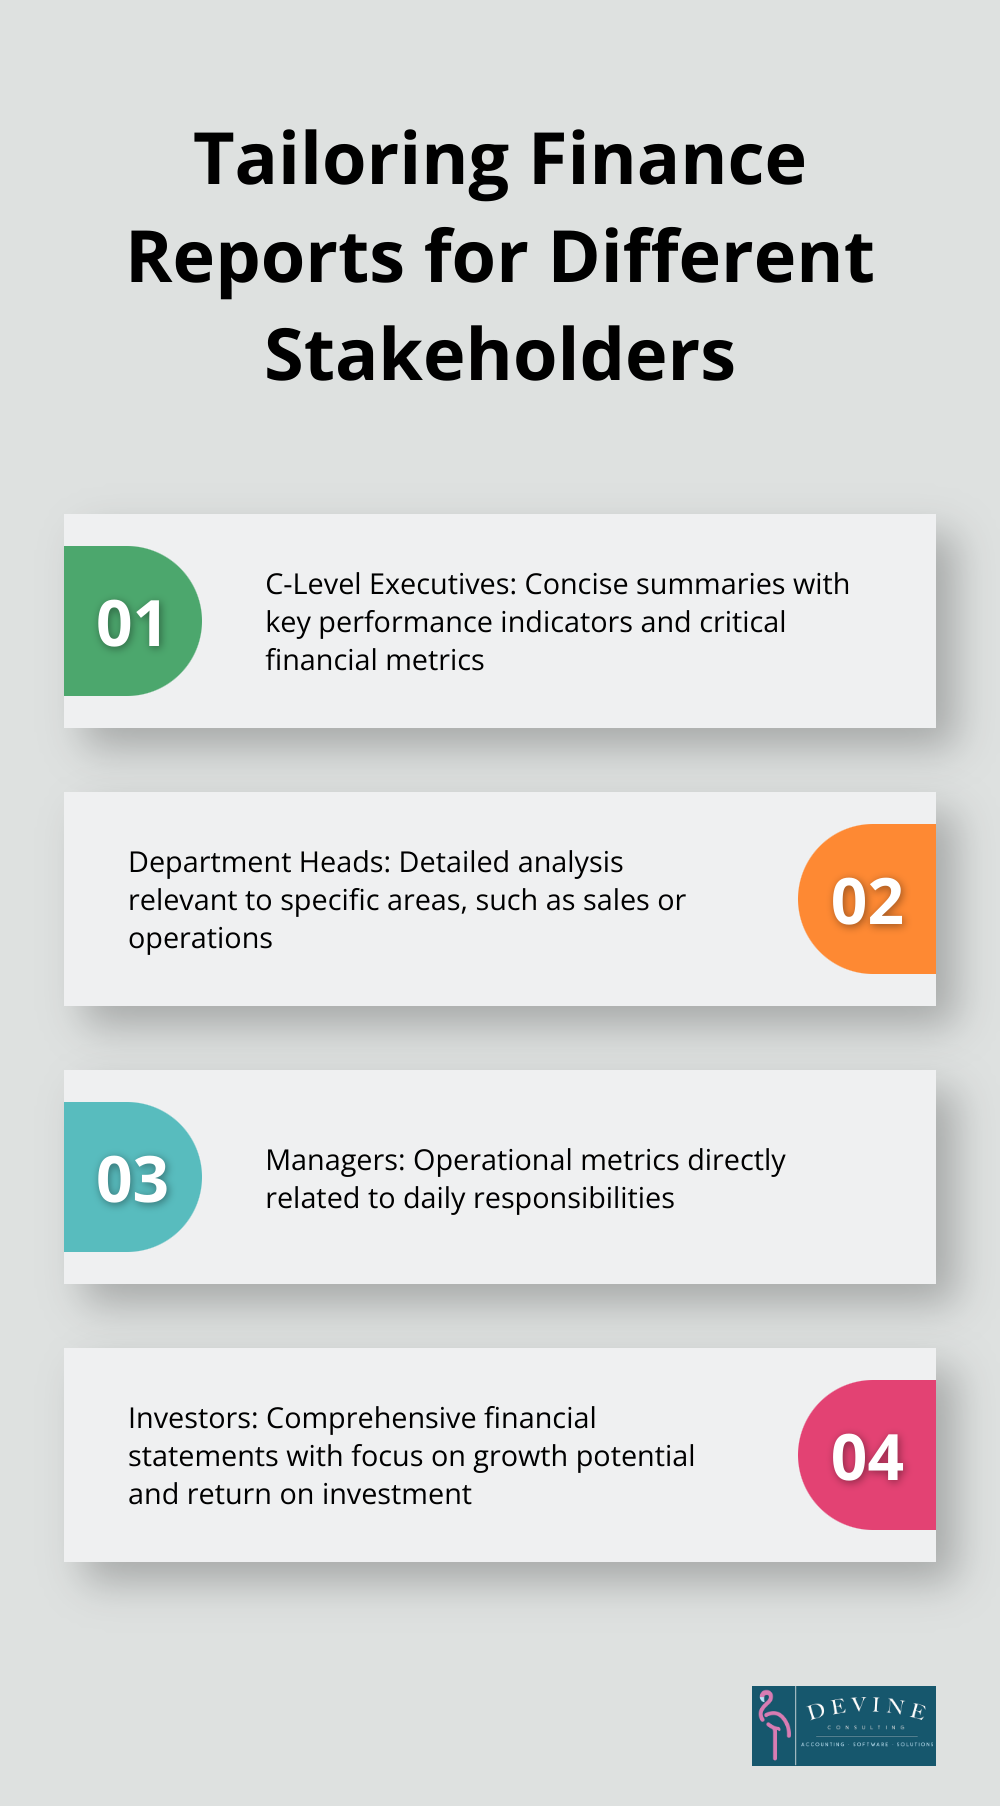
C-suite executives need concise, actionable information for strategic decisions. We create executive summaries that spotlight key performance indicators (KPIs) and critical financial metrics. These summaries typically fit on a single page, using visual elements to convey trends at a glance.
We include year-over-year revenue comparison charts, breakdowns of major expense categories, and snapshots of cash flow. We also highlight significant deviations from forecasts or budgets, with brief explanations and potential business impacts.
Department Heads: Detailed Analysis
Department heads need more granular information relevant to their specific areas. For a sales department head, we provide a detailed breakdown of revenue by product line, customer segment, or geographic region. We include metrics like customer acquisition costs, sales cycle length, and conversion rates.
For operations managers, we focus on efficiency metrics (such as inventory turnover, production costs, and capacity utilization). We also include benchmarks against industry standards to provide context and highlight areas for improvement.
Managers: Operational Metrics
Managers need operational metrics that directly relate to their daily responsibilities. For a marketing manager, we include return on advertising spend (ROAS), customer lifetime value (CLV), and campaign performance metrics. For a human resources manager, we focus on metrics like employee turnover rate, training costs, and productivity indicators.
We ensure these reports include actionable insights. For instance, if we notice a spike in customer acquisition costs, we might suggest investigating the efficiency of current marketing channels or exploring new customer segments.
Investors: Performance and Potential
Investor-focused reports emphasize the company’s financial health, growth potential, and return on investment. We include comprehensive financial statements, but also highlight metrics that matter most to investors (such as earnings per share, price-to-earnings ratio, and dividend yield for public companies).
For private companies, we focus on metrics like burn rate, runway, and key milestones achieved. We also provide forward-looking statements, detailing growth strategies and market opportunities.
This tailored approach to finance management reports ensures that everyone receives the information they need in a format they can easily understand and act upon. It leads to more informed decision-making across all levels of the organization, driving better financial outcomes and strategic alignment.
Final Thoughts
Effective finance management reports drive informed decisions and business growth. These reports include income statements, balance sheets, cash flow statements, and KPIs. Clear language, visual elements, and contextual information enhance data presentation and make complex financial information accessible to all stakeholders.
Customization of finance management reports ensures relevance for different audiences. C-level executives need high-level insights, while department heads require detailed analysis. Managers focus on operational metrics, and investors seek performance indicators. This tailored approach supports strategic planning and improves overall business performance.
Devine Consulting offers comprehensive accounting solutions to help businesses achieve financial stability. Our expertise in finance management reports provides clear, actionable insights that support informed decision-making. We empower organizations to identify opportunities, mitigate risks, and drive growth through data-driven strategies.