How to Optimize Financial Management Reporting

Financial management reporting needs to be accurate, timely, and insightful to drive effective decision-making. At Devine Consulting, we’ve seen how optimized reporting can transform businesses, providing clarity and strategic direction.
However, many organizations struggle with inefficient processes, data silos, and outdated tools that hinder their reporting capabilities. This post will explore practical steps to streamline your financial reporting and unlock its full potential for your business.
How Can We Streamline Financial Data Management?
Efficient financial data management forms the backbone of accurate and timely reporting. Let’s explore practical ways to enhance your data management.
Automate Data Collection
Manual data entry wastes time and introduces errors. Automated financial reporting empowers FP&A leaders with efficiency, accuracy, and valuable insights for better decisions. For example, optical character recognition (OCR) technology automatically extracts data from invoices and receipts, reducing manual input significantly.
Integrate your financial systems with bank accounts for real-time transaction updates. This approach saves time and provides up-to-date cash flow information, which is critical for informed financial decisions.
Centralize Your Financial Data
Data silos often obstruct financial reporting. Centralizing financial data from multiple sources into a single system or data warehouse provides a unified view of your financial position.
Cloud-based accounting software offers real-time access to financial data from any device with an internet connection. These systems can improve data accuracy by eliminating manual consolidation errors.

Standardize Data Formats and Definitions
Inconsistent data formats and definitions across departments lead to confusion and misinterpretation. Establishing company-wide standards for financial data improves reporting and analysis accuracy.
Create a data dictionary that clearly defines financial terms and metrics used in your organization. This resource ensures everyone speaks the same financial language, reducing misunderstandings and improving report consistency.
Set up data validation rules in your financial systems to enforce these standards. For instance, rules for date formats, account codes, or transaction categories (to name a few) can prevent data entry errors and ensure consistency across all financial data.
Implement Regular Data Audits
Regular data audits help maintain data quality and identify areas for improvement. Schedule periodic reviews of your financial data to check for inconsistencies, errors, or outdated information.
Use automated data quality tools to flag potential issues such as duplicate entries, missing data, or outliers. These tools can scan large datasets quickly and efficiently, allowing your team to focus on addressing the identified problems.
Train Your Team
Your team plays a vital role in maintaining data quality. Provide regular training sessions on data management best practices, including proper data entry techniques, the importance of data accuracy, and how to use your financial systems effectively.
Create clear documentation and guidelines for data management processes. This documentation serves as a reference for your team and helps maintain consistency in data handling across your organization.
As we move forward, let’s explore how advanced analytics and visualization tools can transform raw financial data into actionable insights.
How Advanced Analytics Transform Financial Reporting
Advanced analytics and visualization tools revolutionize financial reporting by turning complex data into actionable insights. This transformation enables faster and more informed decision-making across organizations, freeing up time for strategic planning.
Predictive Analytics for Financial Forecasting
Predictive analytics uses historical data, statistical algorithms, and machine learning techniques to identify future trends and outcomes. This approach leads to more accurate forecasts and proactive decision-making in financial reporting.
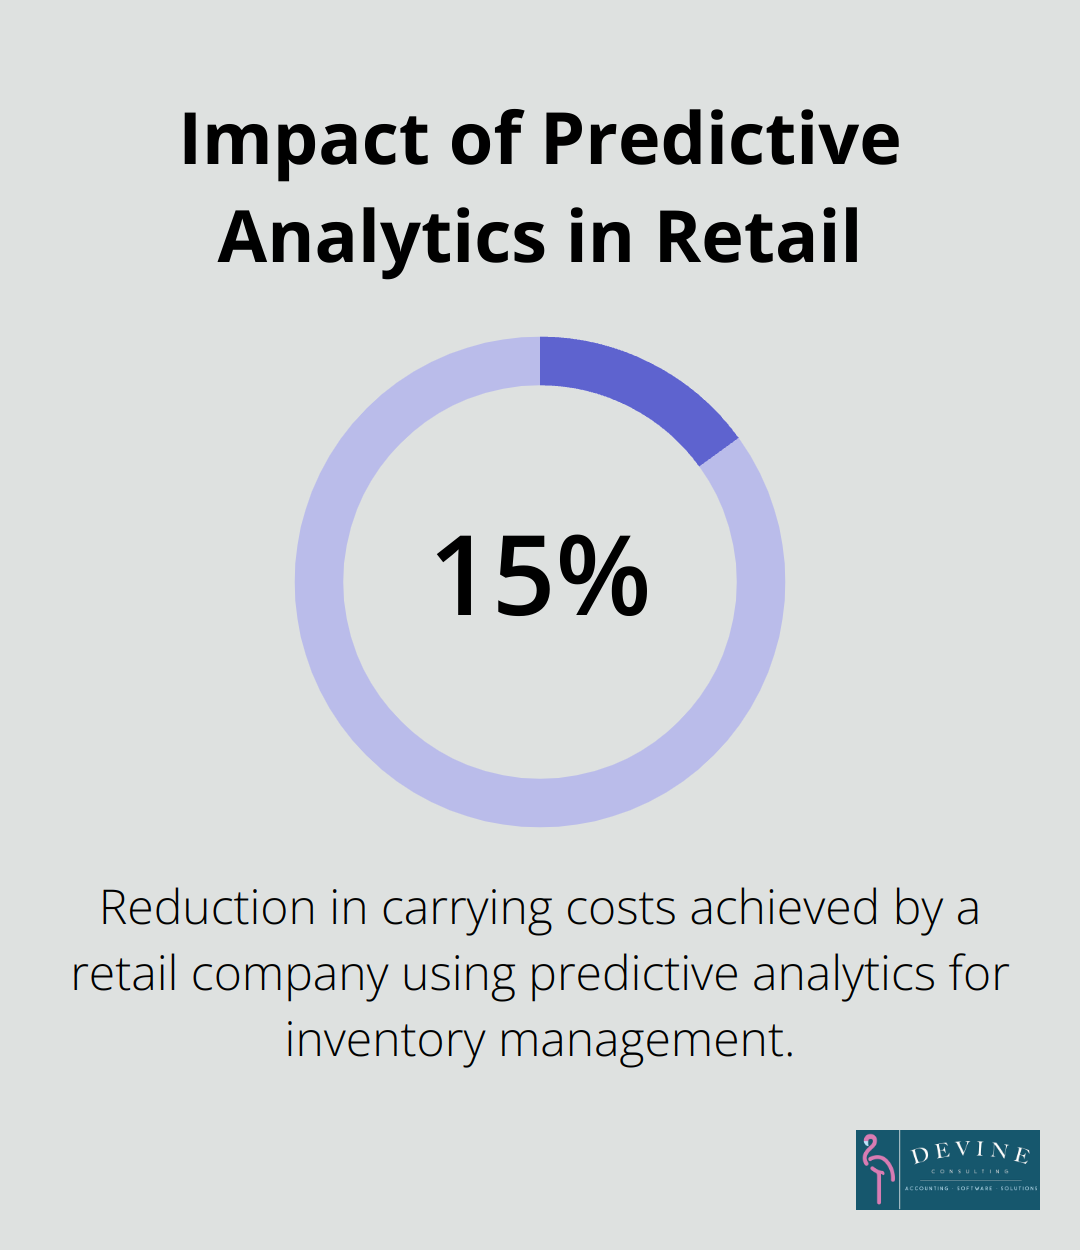
A retail company implemented predictive analytics to forecast seasonal demand. The analysis of past sales data, weather patterns, and economic indicators improved inventory management and reduced carrying costs by 15%.
Tools like SAS Forecast Server or Oracle Crystal Ball offer user-friendly interfaces and powerful forecasting capabilities (even for those without extensive data science backgrounds).
Interactive Dashboards for Real-Time Insights
Static reports become obsolete in today’s fast-paced business environment. Interactive dashboards provide real-time financial insights, which allow stakeholders to explore data dynamically and make timely decisions.
A manufacturing company implemented an interactive dashboard to monitor key financial metrics across their production lines. This real-time visibility allowed them to identify underperforming areas quickly and implement corrective actions, resulting in a 10% increase in overall efficiency.
Popular tools for creating interactive dashboards include Tableau, Power BI, and Looker. These platforms offer drag-and-drop interfaces (making it easy to create visually appealing and informative dashboards without extensive coding knowledge).
Data Visualization for Clearer Communication
Data visualization transforms complex financial data into easily digestible visual formats. This approach enhances understanding across all levels of an organization, from C-suite executives to operational managers.
A healthcare provider visualized their revenue cycle data using heat maps and scatter plots. This visual approach quickly highlighted bottlenecks in their billing process, leading to process improvements that reduced days in accounts receivable by 20%.
To enhance your data visualization capabilities, explore tools like D3.js for custom visualizations or Flourish for quick, template-based charts and graphs. The goal is to present financial data in a way that tells a clear, compelling story.
The implementation of these advanced analytics and visualization techniques can significantly enhance your financial reporting capabilities. However, the choice of tools must align with your organization’s specific needs and technical capabilities. The next chapter will explore how to tailor these reports to meet the diverse needs of different stakeholders within your organization.
How to Customize Financial Reports for Different Stakeholders
Financial reports should not follow a one-size-fits-all approach. Tailored reporting can significantly improve decision-making across various levels of an organization. This chapter explores how to create financial reports that cater to the specific needs of different stakeholders.
Identify Stakeholder-Specific KPIs
Different stakeholders require different metrics to make informed decisions. The CEO might focus on overall profitability and market share, while a sales manager needs detailed revenue breakdowns by product or region.
Start by mapping out your key stakeholders and their primary concerns. Then, identify the most relevant Key Performance Indicators (KPIs) for each group. For example:
- C-Suite Executives: EBITDA, Return on Investment (ROI), Market Share
- Operations Managers: Operational Efficiency, Cost per Unit, Inventory Turnover
- Sales Teams: Revenue Growth, Customer Acquisition Cost, Sales Cycle Length
- Investors: Earnings Per Share (EPS), Debt-to-Equity Ratio, Free Cash Flow
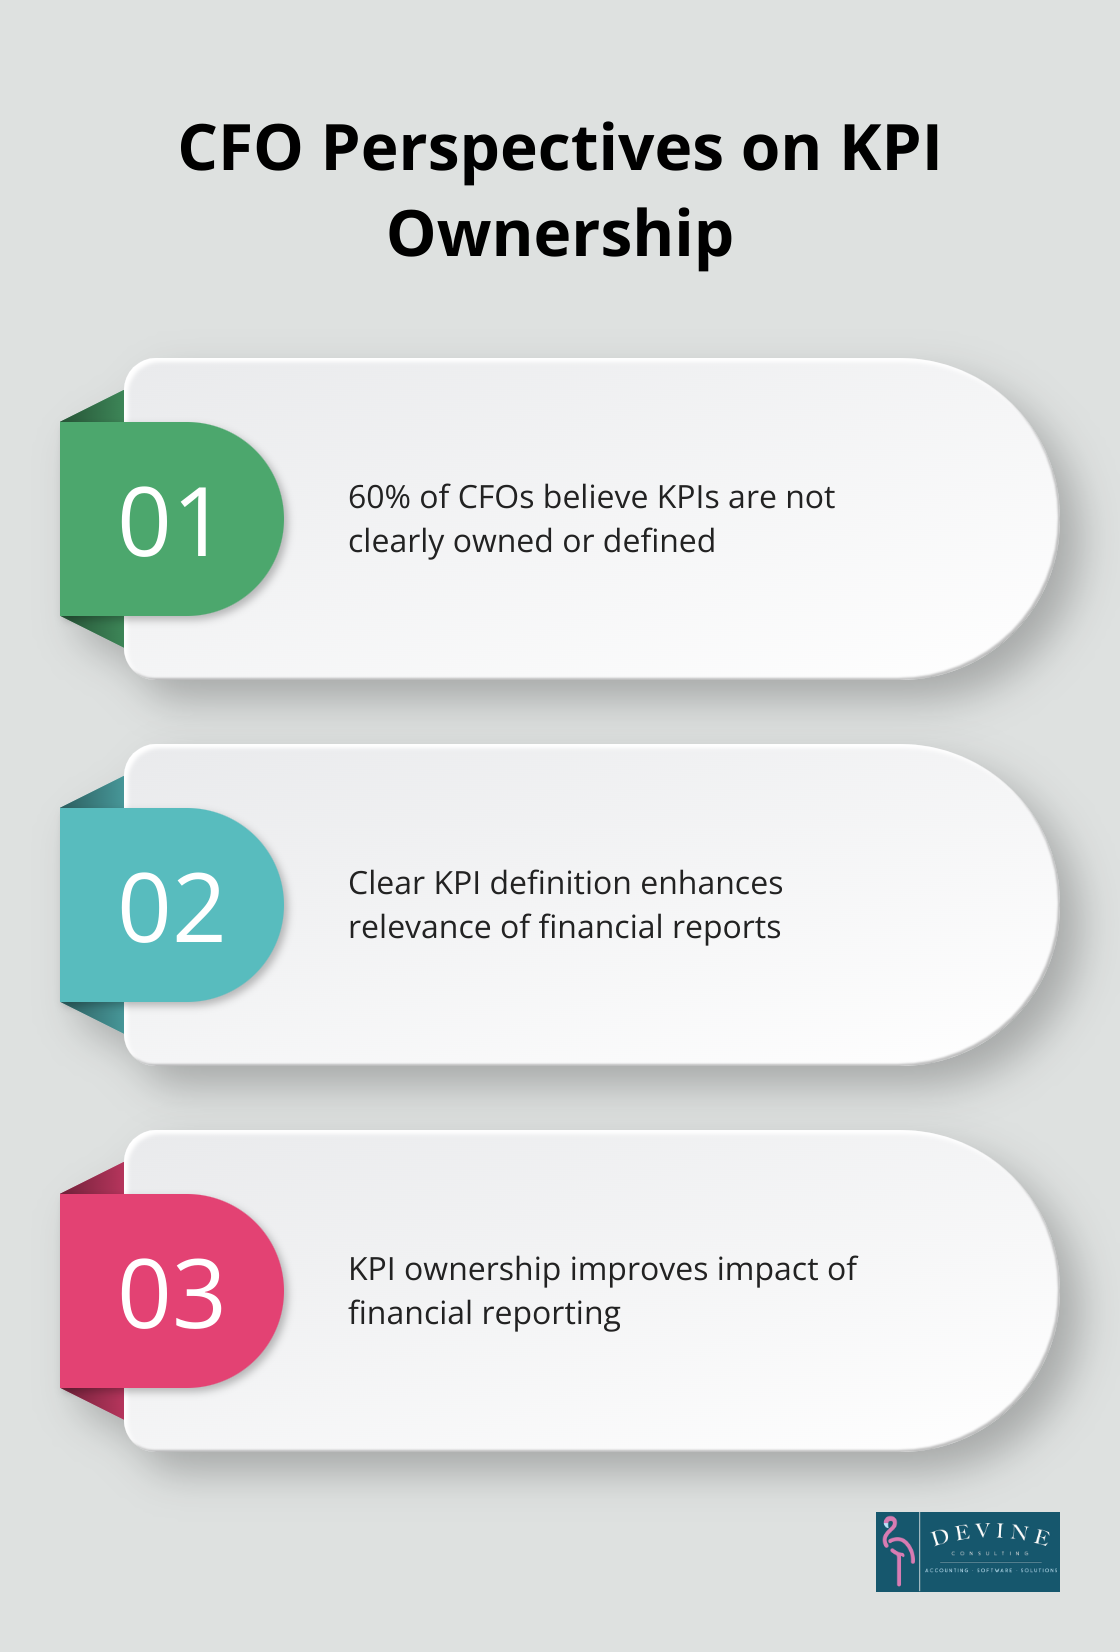
A survey by FSN in 2021 found that 60% of CFOs believe that KPIs are not clearly owned or defined within their organization. Clear KPI definition and ownership can significantly enhance the relevance and impact of your financial reports.
Customize Report Formats and Detail Levels
After you identify stakeholder-specific KPIs, present this information in the most digestible format for each group. This might involve creating different versions of your financial reports with varying levels of detail and presentation styles.
For board members and C-suite executives, create high-level summary reports that provide a quick overview of the company’s financial health. These reports should focus on trend analysis and strategic insights rather than granular details.
Operational managers need more detailed reports that drill down into specific areas of the business. For example, a production manager might need a report that breaks down costs by production line, shift, or individual product.
Use different visualization techniques for different stakeholders. While a CFO might prefer traditional financial statements, a marketing director might find a visual representation of customer acquisition costs more useful.
Implement Role-Based Access to Financial Information
Security and confidentiality are paramount in financial reporting. Role-based access ensures that stakeholders only see the information relevant to their role and level of authority.
Modern financial reporting software often includes features for setting up user roles and permissions. This allows you to control who can view, edit, or share different types of financial information.
Try to set up the following access levels:
- Full Access: C-suite executives and finance team leaders
- Department-Specific Access: Managers can view financial data related to their department
- Limited Access: Team members can see high-level company performance metrics
The goal is to provide each stakeholder with the information they need to make informed decisions, while maintaining data security and confidentiality.
Tailoring your financial reports to meet the specific needs of different stakeholders can enhance the value and impact of your financial reporting. This approach not only improves decision-making across the organization but also increases engagement with financial data at all levels.
Final Thoughts
Financial management reporting needs to be accurate, timely, and insightful to drive effective decision-making. Optimized reporting processes transform raw financial data into actionable insights that propel businesses forward. Advanced analytics and visualization tools take reporting to new heights, enabling more informed decision-making through predictive analytics, interactive dashboards, and clear data visualization techniques.
Tailoring reports to stakeholder needs ensures the right information reaches the right people. Identifying key performance indicators for different stakeholders, customizing report formats, and implementing role-based access maximize the impact of financial reports across all organizational levels. Technology plays a pivotal role in enhancing reporting efficiency, with cloud-based accounting software and advanced analytics platforms automating processes and providing deeper insights.
Devine Consulting understands the challenges of financial management reporting. Our comprehensive accounting solutions can help streamline financial processes, improve reporting accuracy, and gain valuable insights for strategic decision-making. As your business evolves, so should your reporting strategies (stay open to new technologies and methodologies to continually improve your financial insights).