How to Use QuickBooks Financial Reports Effectively

QuickBooks financial reports contain the data you need to make smart business decisions. Yet 73% of small business owners admit they struggle to interpret their financial data effectively.
At Devine Consulting, we see businesses miss growth opportunities because they don’t know how to read their reports properly. This guide shows you exactly how to extract actionable insights from your QuickBooks data.
Which QuickBooks Reports Matter Most
QuickBooks Desktop provides over 150 different reports, but most businesses only need to focus on 12 essential ones to monitor their financial health effectively. The Company and Financial report group contains your most important reports: Profit and Loss shows whether you make money, Balance Sheet reveals your financial position, and Cash Flow Statement tracks money movement. These three reports form the foundation of financial decision-making, with the Profit and Loss report accessed most frequently by 89% of QuickBooks users (according to Intuit data).

The Revenue Intelligence Reports
Sales reports reveal patterns that drive growth decisions. The Sales by Customer Summary report identifies your top 20% of customers who typically generate 80% of revenue. A/R Aging Summary tracks outstanding invoices, giving you a clear view of who owes you, how much, and for how long, so you can act fast to improve cash flow. The Job Profitability Summary shows which services or products deliver the highest margins, which allows you to focus resources on profitable activities. Generate these reports monthly and compare year-over-year data to spot trends that monthly comparisons might miss due to seasonal fluctuations.
Cost Control Through Expense Analysis
A/P Aging reports prevent late payment fees and help you negotiate better vendor terms. The Expense by Vendor Detail report identifies spending patterns, with successful businesses typically finding 15-20% cost savings when they analyze vendor expenses quarterly. Payroll Summary reports track labor costs, which can range from 30% to 35% of total revenue for service businesses. Monitor these metrics monthly, as rising labor costs have negatively impacted 75% of medium-sized enterprises according to the Business Development Bank of Canada.
Advanced Reports for Deeper Insights
Inventory Valuation Summary provides vital information about stock status and helps prevent costly stockouts or overstocks. The Trial Balance report supports tax preparation and ensures your books balance correctly before you generate financial statements. Banking Reports (such as Deposit Detail and Reconciliation Discrepancy) help you monitor transactions and identify discrepancies that could affect your cash position.
Once you know which reports to prioritize, the next step involves understanding how to read and interpret the data these reports present.
How Do You Turn QuickBooks Data Into Business Decisions
Your Profit and Loss statement reveals whether your business generates sustainable profits, but correct interpretation requires understanding the difference between gross profit margin and net profit margin. Gross profit margin equals revenue minus cost of goods sold divided by revenue, and successful service businesses maintain margins between 70% and 80%. Net profit represents total revenue minus all expenses, and healthy businesses achieve net margins of 10% to 15%.
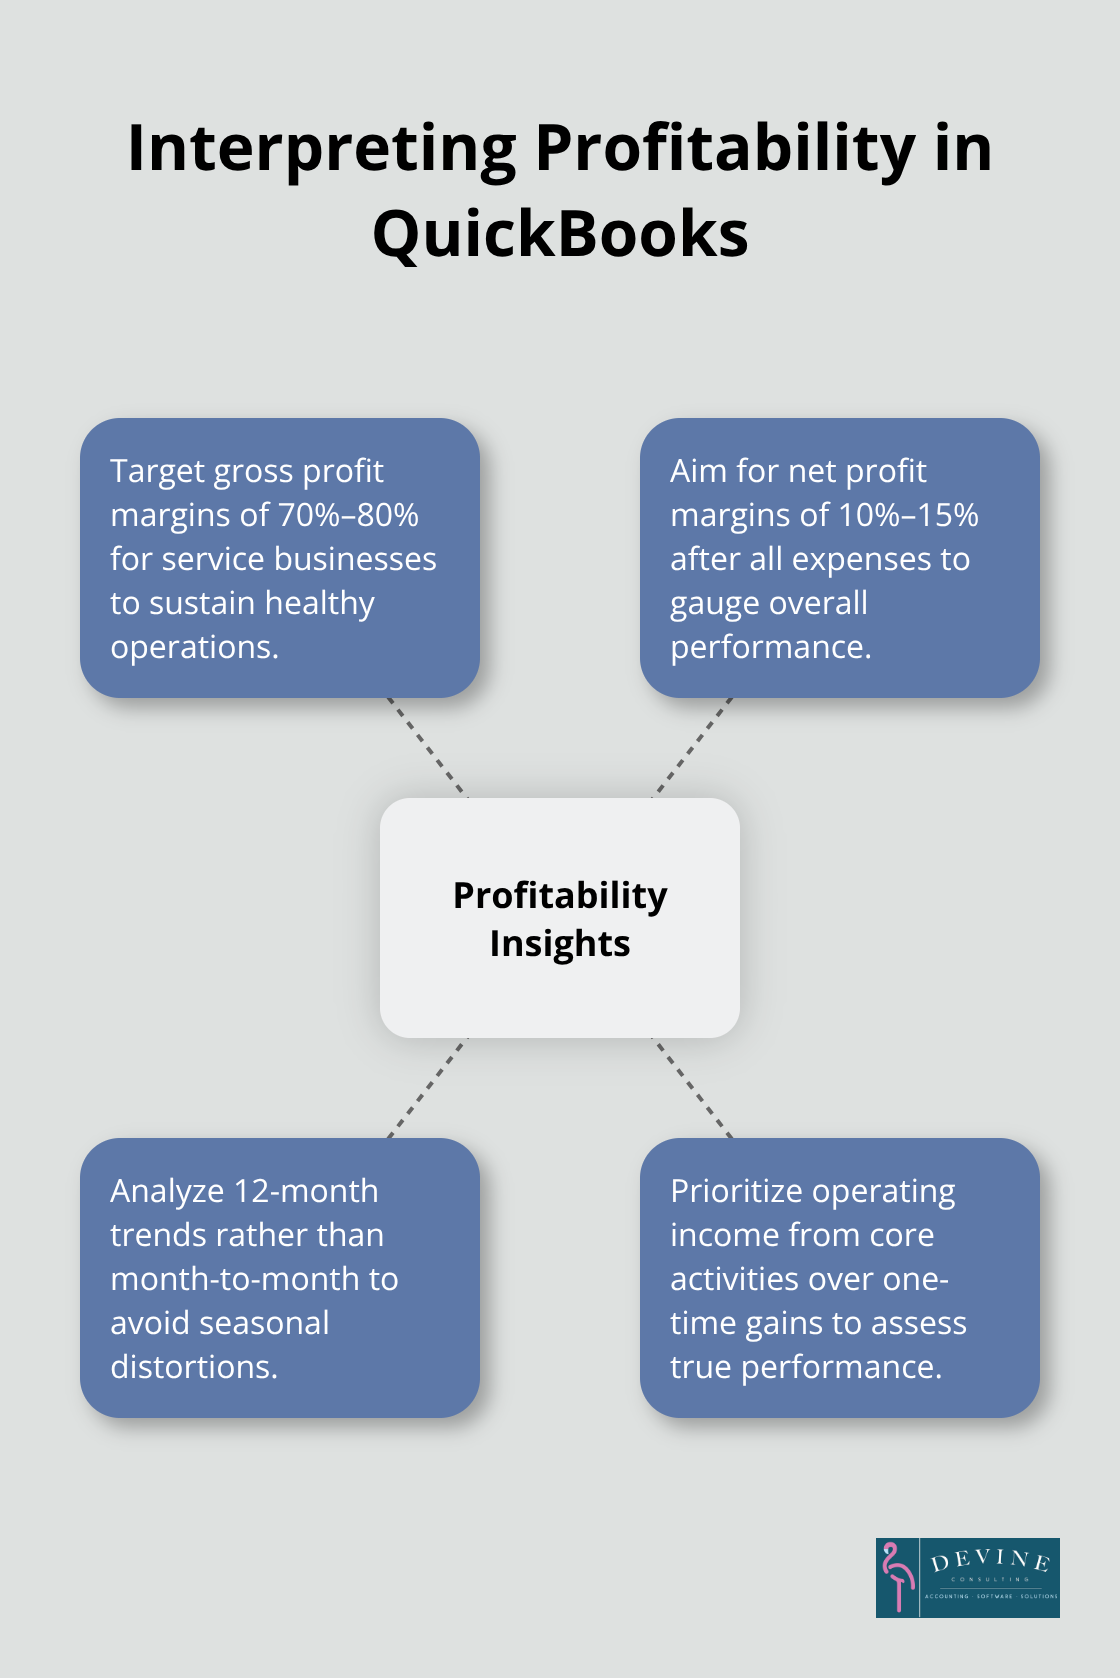
QuickBooks calculates these automatically, but you must analyze trends over 12-month periods rather than month-to-month comparisons to avoid seasonal variations that mislead. Focus on operating income from core activities rather than one-time gains, as sustainable profitability comes from daily operations, not irregular income sources.
Cash Flow Reports Prevent Business Failure
Cash flow problems cause 35% of small business failures due to insufficient demand for their product or service, which makes cash flow reports your most important tool. QuickBooks cash flow statements track money movement across operating, investing, and financing activities, with operating activities that generate the majority of healthy cash inflows. Monitor your cash conversion cycle by comparing accounts receivable days with accounts payable days; businesses with receivables that collect faster than payables perform significantly better. Run weekly cash flow projections during growth phases or tight cash periods, and maintain cash reserves equal to three months of operating expenses to handle unexpected downturns.
Dashboard KPIs Drive Real-Time Decisions
QuickBooks dashboard views display critical metrics like debt-to-equity ratios, current ratios, and revenue growth rates in real-time formats that enable immediate action. Track debt-to-equity ratios monthly as this important financial metric shows how capital has been raised to run a business; ratios that exceed 100% signal potential financial distress and require immediate cost reduction or revenue acceleration strategies. Monitor current ratios (current assets divided by current liabilities) to maintain liquidity; ratios below 1.0 indicate cash flow problems within 90 days. Set up automated alerts for key thresholds and review dashboard metrics weekly rather than wait for month-end reports, as early detection of negative trends allows corrective action before problems become critical.
Even with perfect data interpretation skills, businesses still make costly mistakes when they set up their reports incorrectly or skip essential bookkeeping and accounting basics or professional bookkeeping services.
What QuickBooks Reporting Mistakes Cost Businesses Money
Incorrect chart of accounts setup destroys report accuracy and leads to financial decisions based on false data. When businesses categorize office supplies as equipment or mix personal expenses with business costs, their Profit and Loss statements show distorted margins that trigger wrong pricing decisions. QuickBooks requires specific account types for accurate reports: use expense accounts for recurring costs, asset accounts for equipment purchases, and liability accounts for loans. Misclassified transactions create ripple effects across multiple reports, with many small businesses discovering significant categorization errors during their first professional bookkeeping review. Set up your chart of accounts before you enter any transactions, and train all users on proper categorization to prevent costly mistakes that compound over time.
Account Reconciliation Prevents Report Disasters
Unreconciled accounts render financial reports worthless and hide critical cash flow problems until they become emergencies. Banks process transactions with different timing than your QuickBooks entries, which creates discrepancies that distort cash positions and accounts receivable balances. Reconcile checking accounts monthly within five business days of receiving bank statements, as delays allow errors to multiply and become harder to identify. Credit card reconciliation prevents duplicate expense entries that inflate costs by 10% to 15% in affected categories. The Reconciliation Discrepancy report identifies specific transactions that cause imbalances, but only when you reconcile consistently.
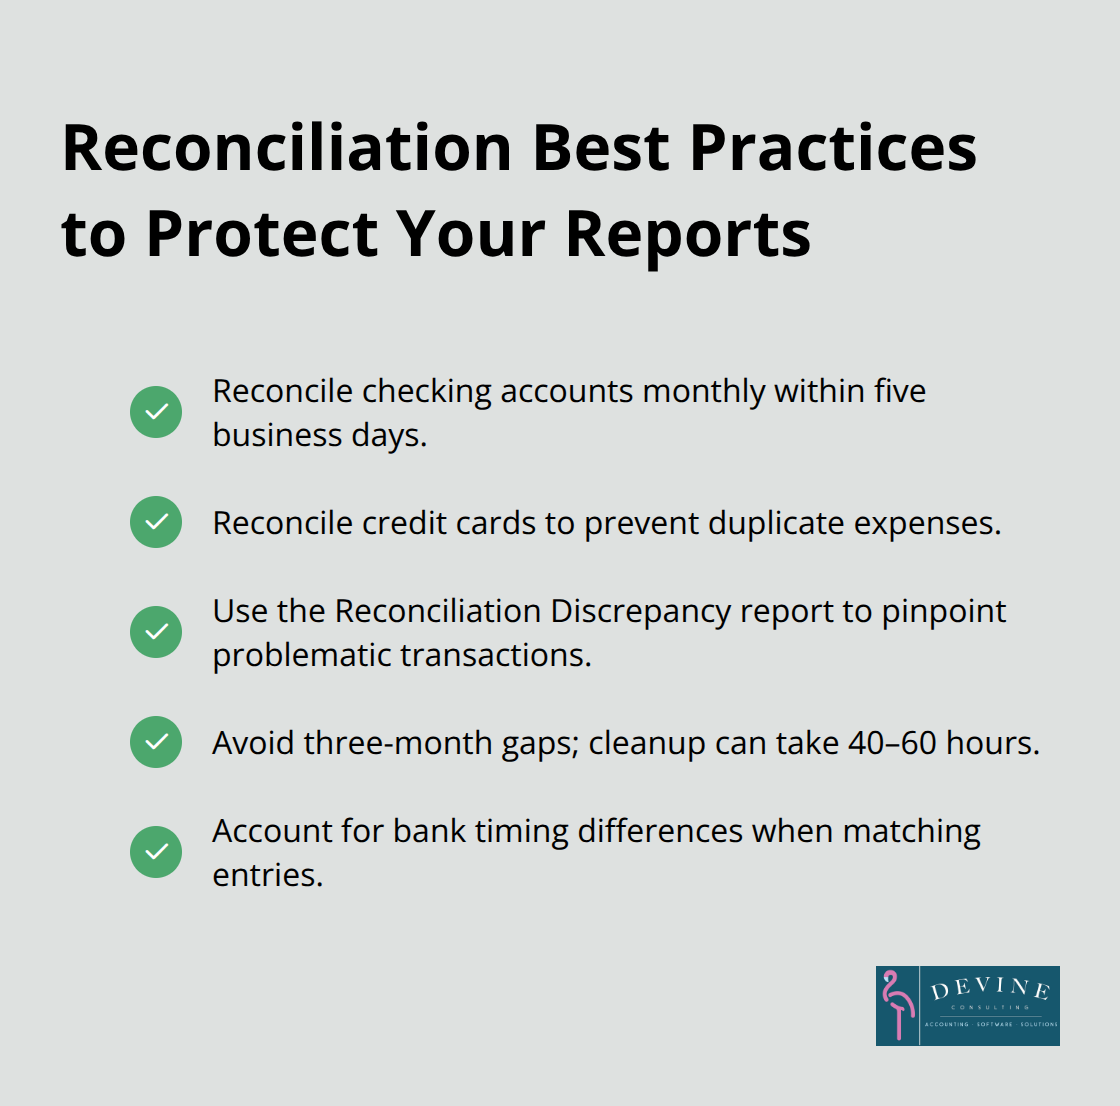
Businesses that skip reconciliation for three months or longer typically require 40 to 60 hours of professional cleanup work to restore report accuracy.
Regular Report Reviews Catch Problems Early
Monthly financial report analysis prevents small issues from becoming business-threatening problems, yet many small business owners review reports infrequently. Weekly cash flow report reviews during growth periods help identify collection problems before they impact operations, while monthly trend analysis spots declining margins that require immediate cost adjustments. Set calendar reminders for report generation and analysis rather than rely on memory, as consistent timing allows meaningful period-to-period comparisons. Compare current performance against the same month in previous years to account for seasonal variations that monthly comparisons miss. Businesses that review reports weekly maintain better cash flow positions than those that review monthly, according to accounting industry studies. Poor bookkeeping practices cost businesses significant amounts annually in missed deductions and compliance issues.
Final Thoughts
Effective QuickBooks financial reports transform raw data into actionable business intelligence when you follow proven practices. Focus on the 12 essential reports rather than all 150 available options, reconcile accounts monthly before you generate reports, and review performance weekly during growth periods. Set up your chart of accounts correctly from the start, as misclassified transactions create errors across multiple reports that cost businesses thousands in wrong decisions.
Regular financial report analysis delivers measurable benefits across all business operations. Businesses that review reports weekly maintain better cash flow positions, while quarterly expense analysis typically reveals 15-20% cost savings opportunities. Monitor key ratios like debt-to-equity and current ratios monthly to catch problems before they become critical (especially during rapid growth phases).
Professional support accelerates your financial management success with QuickBooks financial reports. Devine Consulting provides comprehensive accounting solutions that help businesses achieve financial stability while focusing on core operations. We at Devine Consulting turn QuickBooks data into strategic advantages that drive sustainable growth through accurate bookkeeping and strategic financial planning.