Types of Financial Analysis: Key Methods Explained

Financial analysis is the backbone of informed business decisions. At Devine Consulting, we’ve seen firsthand how understanding different types of financial analysis can transform a company’s strategy and performance.
This blog post breaks down key methods of financial analysis, including ratio analysis, trend analysis, and comparative analysis. We’ll explore how these techniques can provide valuable insights into a company’s financial health, growth patterns, and competitive position.
How Do Financial Ratios Reveal Company Health?
Financial ratios provide a snapshot of a company’s financial health. These powerful tools help businesses make informed decisions and improve their financial performance.
Liquidity: Can You Pay Your Bills?
Liquidity ratios measure a company’s ability to meet short-term obligations. The current ratio compares current assets to current liabilities. A ratio of 2:1 or higher indicates good health. For instance, a manufacturing company with a current ratio of 2.5 stands in a strong position to cover its short-term debts.
The quick ratio (also known as the acid-test ratio) offers a more stringent measure. It excludes inventory from current assets. A quick ratio of 1:1 or higher shows good short-term liquidity. In the retail sector, where inventory levels typically run high, a quick ratio of 0.5 might prove acceptable.
Profitability: Are You Making Money?
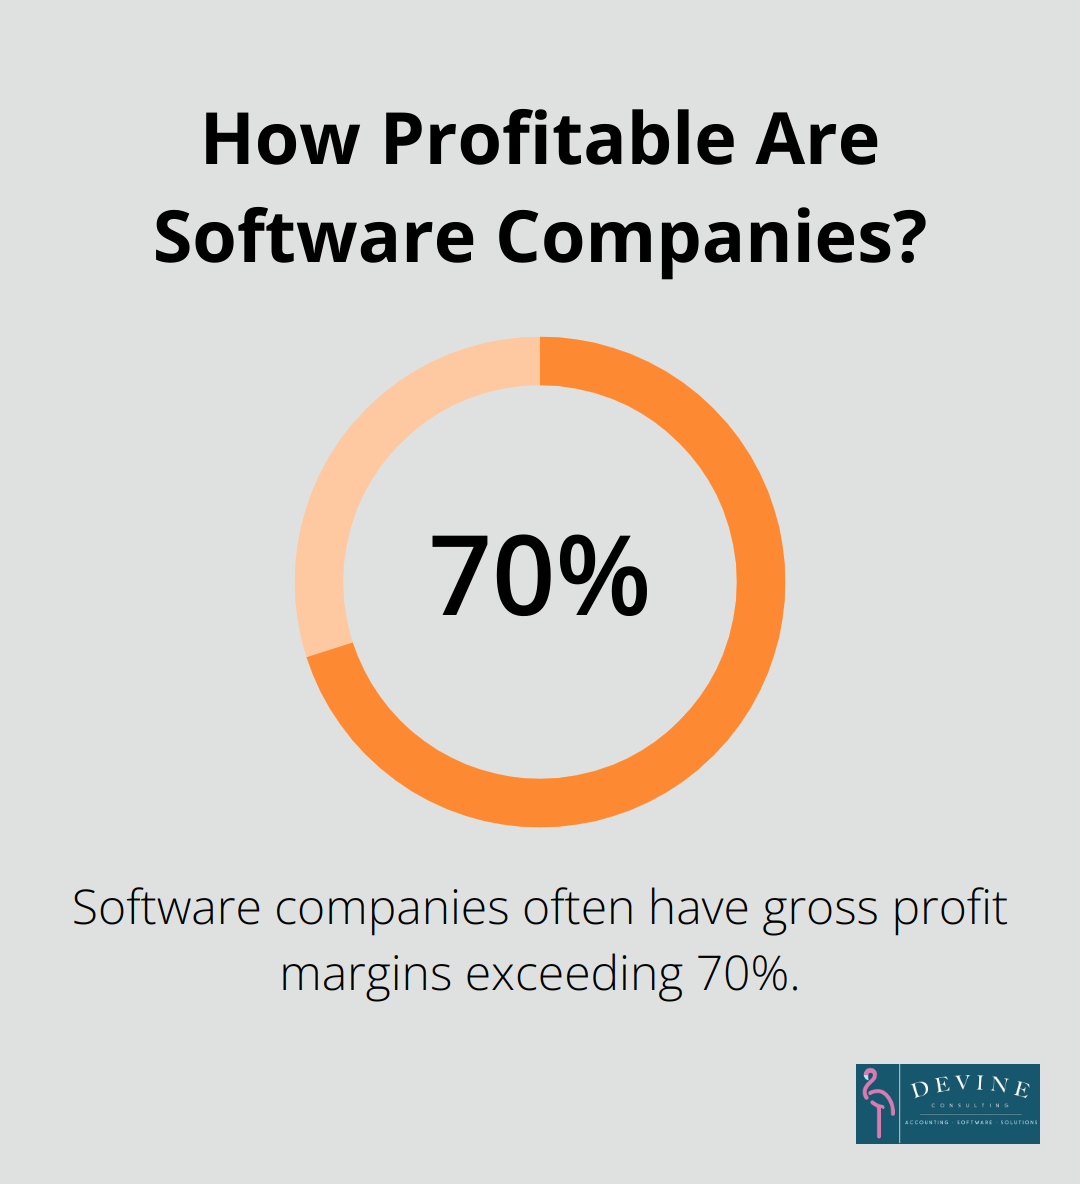
Profitability ratios demonstrate how effectively a company generates profit. The gross profit margin reveals the percentage of revenue left after accounting for the cost of goods sold. Software companies often boast gross profit margins exceeding 70%.
Net profit margin accounts for all expenses, painting a clearer picture of overall profitability. The S&P 500 profit margin is an important indicator of overall market profitability.
Efficiency: How Well Are You Using Your Assets?
Efficiency ratios measure how well a company uses its assets and manages its liabilities. The inventory turnover ratio shows how quickly a company sells its inventory. A higher ratio generally indicates better performance, but industry norms vary. A grocery store might have a turnover ratio of 15, while a luxury car dealership might have a ratio of 4.
The accounts receivable turnover ratio indicates how quickly a company collects payments. A higher ratio suggests more efficient collection practices. A business-to-business software company with a ratio of 8 collects payments faster than one with a ratio of 6.
Leverage: How Much Debt Are You Carrying?
Leverage ratios assess a company’s debt levels. The debt-to-equity ratio compares total liabilities to shareholders’ equity. A lower ratio indicates less risk, but ideal ratios vary by industry. In capital-intensive industries, such as manufacturing, debt-to-equity ratios above 1 can be considered acceptable, while the technology sector often prefers a ratio below 1.
The interest coverage ratio shows how easily a company can pay interest on its debt. A ratio of 2 or higher generally indicates safety. A manufacturing company with an interest coverage ratio of 4 stands in a stronger position to meet its debt obligations than one with a ratio of 1.5.
These key financial indicators help companies make more informed decisions about their operations, investments, and financial strategy. As we move forward, we’ll explore how trend analysis can uncover important patterns in a company’s financial data over time.
How Trend Analysis Uncovers Financial Patterns
Horizontal Analysis: Year-Over-Year Insights
Horizontal analysis compares financial data across different time periods. This method reveals growth rates and changes in financial performance. The first step in performing a horizontal analysis is to calculate the net difference in dollar terms between comparable periods. This approach can help identify trends and patterns in financial data over time.
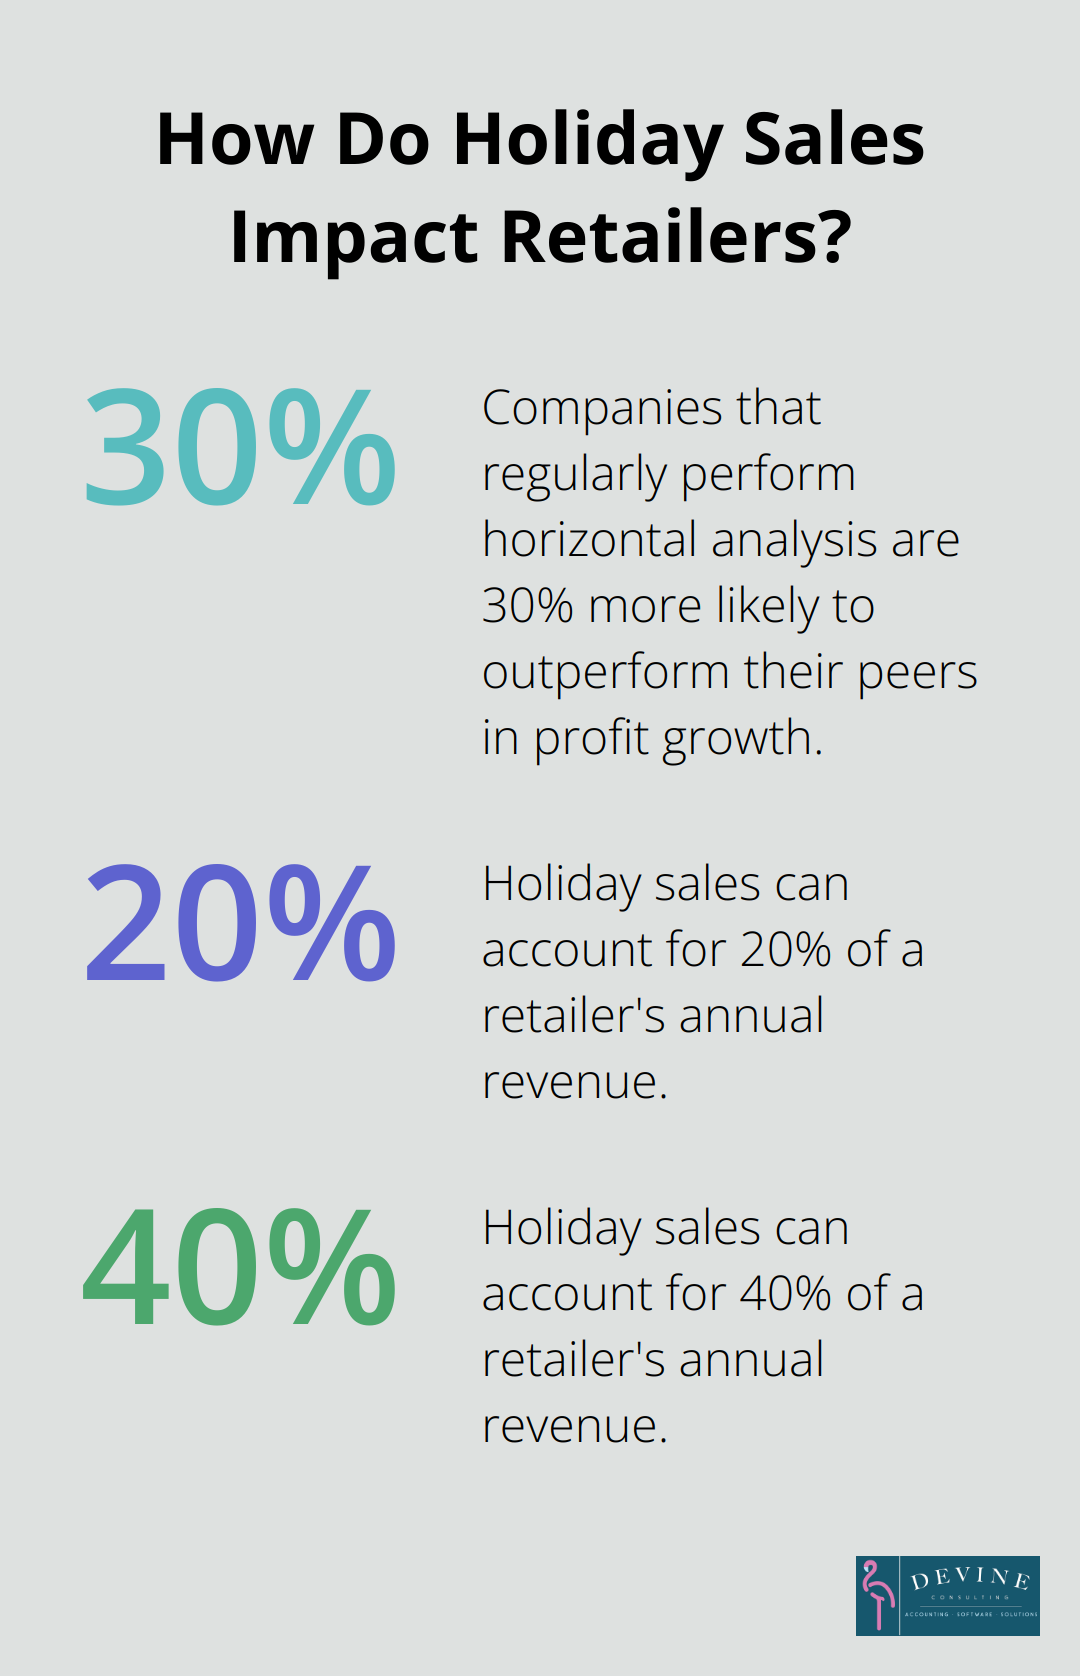
A study by McKinsey & Company found that companies which regularly perform horizontal analysis are 30% more likely to outperform their peers in terms of profit growth.
Vertical Analysis: Proportional Insights
Vertical analysis expresses each line item on a financial statement as a percentage of a base figure. This approach highlights the relative importance of different financial components. A software company might find that research and development expenses increased from 20% to 25% of total revenue over three years, indicating a shift in strategic focus.
Time Series Analysis: Seasonal and Cyclical Patterns
Time series analysis identifies recurring patterns in financial data. This method proves particularly useful for businesses with seasonal fluctuations or those affected by economic cycles. A retail company might observe that sales consistently peak in December, with a 40% increase compared to the annual average.
The National Retail Federation reports that holiday sales can account for 20% to 40% of a retailer’s annual revenue (emphasizing the importance of recognizing and planning for seasonal trends).
Combining Analysis Methods for Comprehensive Insights
The true power of trend analysis emerges when these methods work together. A company might use horizontal analysis to identify a steady increase in marketing expenses, vertical analysis to determine if these expenses are growing disproportionately to revenue, and time series analysis to pinpoint seasonal spikes in marketing costs.
Leveraging Technology for Trend Analysis
Modern financial software (such as those offered by Devine Consulting) automates much of the data collection and calculation process for trend analysis. This allows businesses to focus on interpreting results and making strategic decisions based on the insights gained.
As we move forward, we’ll explore how comparative analysis allows businesses to benchmark their performance against industry standards and competitors, providing yet another layer of valuable financial insight.
How to Benchmark Your Financial Performance
Industry Comparisons: Measure Your Competitive Position
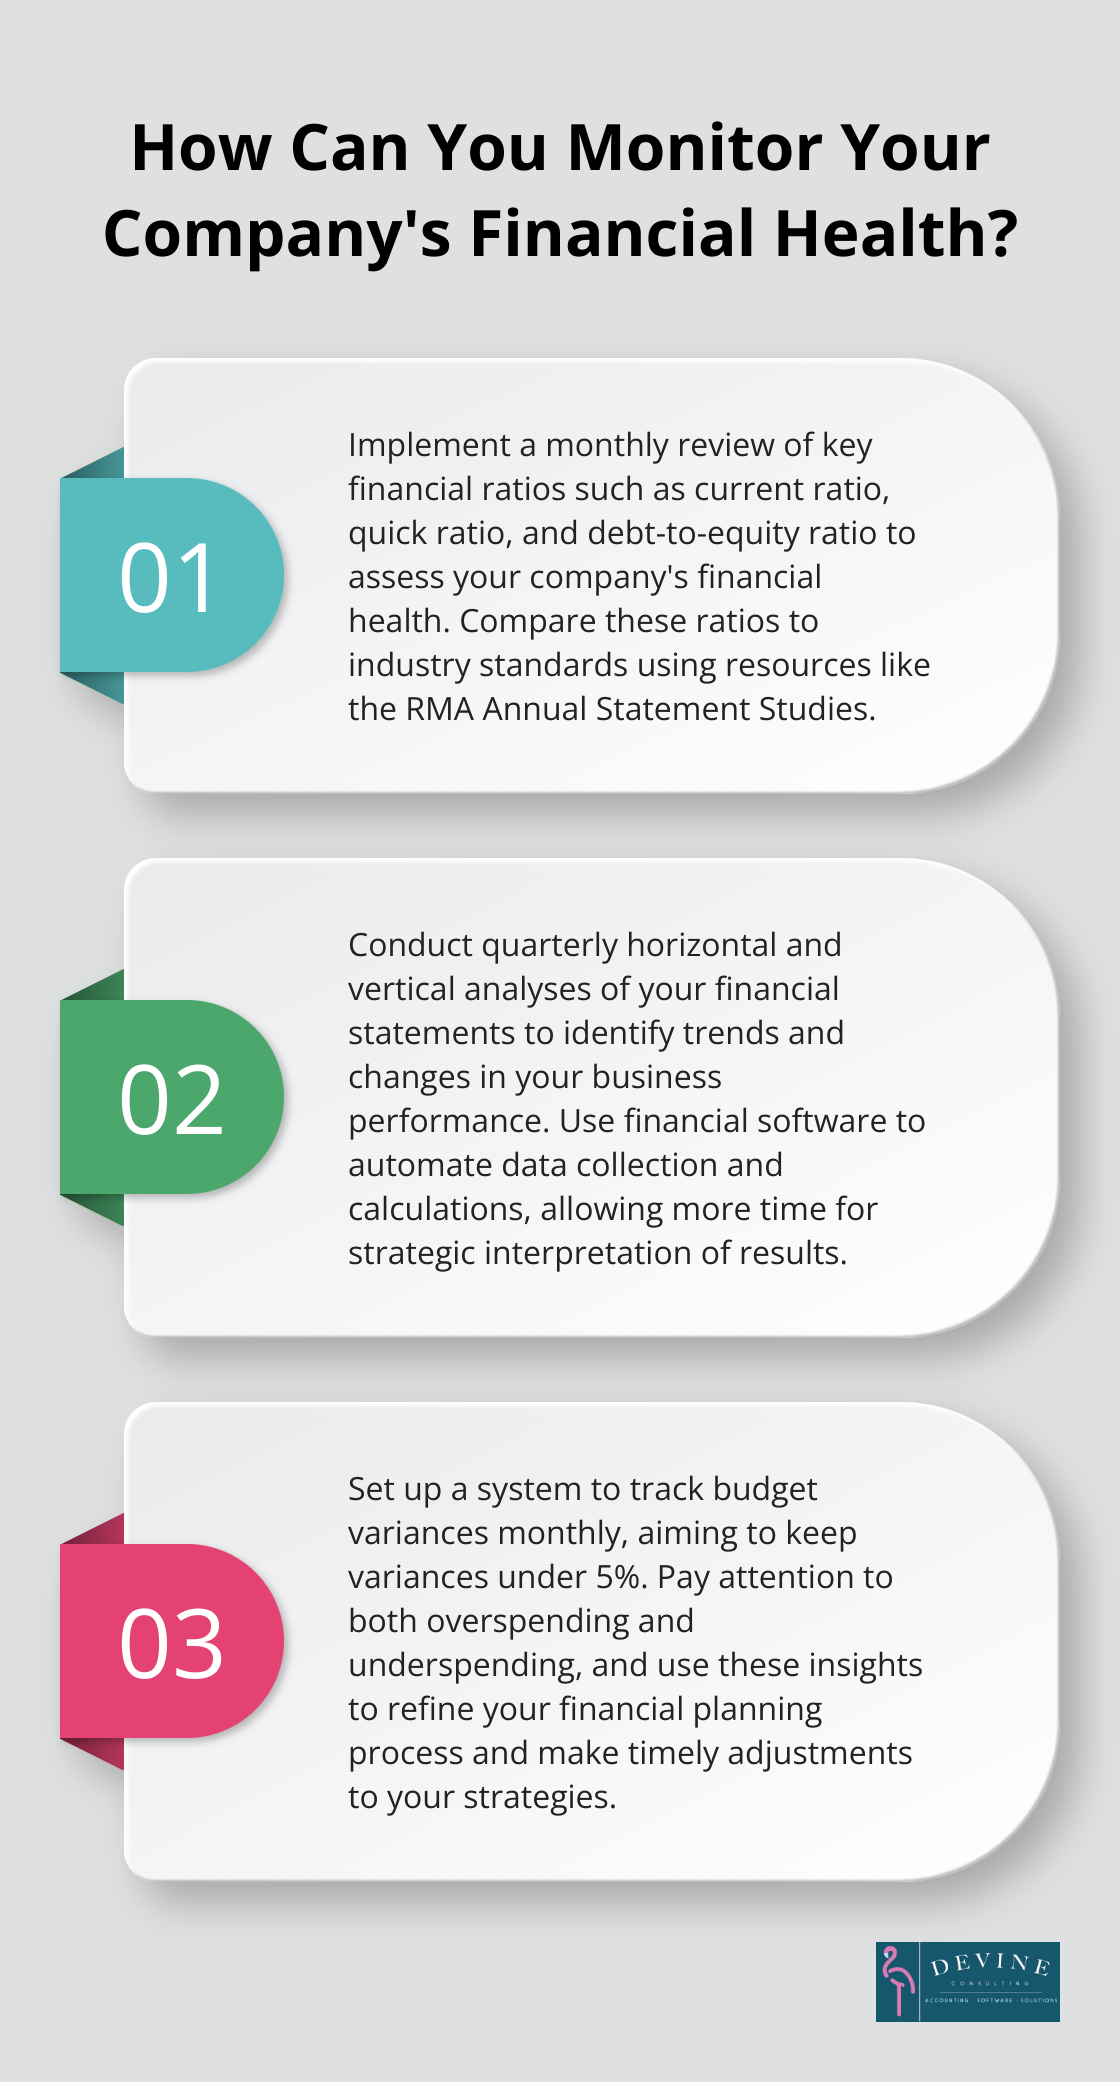
Comparative analysis allows you to evaluate your company’s financial performance against industry standards. The RMA Annual Statement Studies provide industry-specific financial ratios, enabling you to compare your performance to similar-sized businesses in your sector.
A manufacturing company with a 25% gross profit margin might appear healthy in isolation. However, an industry average of 35% suggests room for improvement in production efficiency or pricing strategy.
Historical Performance: Track Your Progress
Analyzing your company’s financial metrics over time reveals important trends and progress. Research by Bain & Company indicates that positive ESG outcomes are a trait of successful companies.
Look beyond year-over-year comparisons. Analyze 3-5 year trends in key metrics like revenue growth, profit margins, and return on assets. This longer-term view helps distinguish between temporary fluctuations and fundamental shifts in your business performance.
For instance, if your accounts receivable turnover has steadily decreased from 8 to 6 over three years, it signals a need to reassess your collection practices.
Budget vs. Actual: Refine Your Financial Planning
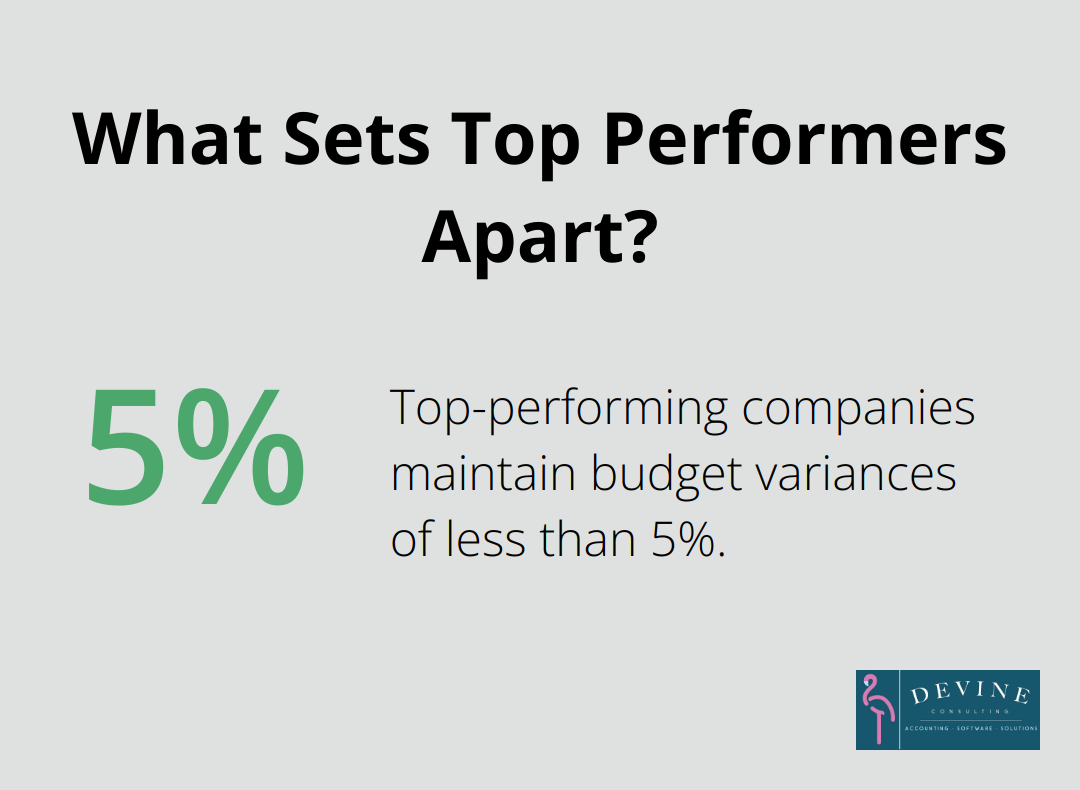
Comparing actual results to budgeted figures refines your financial planning process. The American Productivity & Quality Center reports that top-performing companies maintain budget variances of less than 5%.
Analyze both positive and negative variances. While it’s tempting to focus solely on areas where you’ve overspent, understanding why you’ve underspent in certain categories can also reveal important insights about your business operations or market conditions.
For example, if your marketing expenses are 20% under budget but sales targets are met, it might indicate higher marketing efficiency or a shift in customer acquisition channels.
Regular variance analysis allows for timely adjustments to your budget and strategies. Quarterly reviews often suffice for small businesses, while larger companies might benefit from monthly assessments.
Leveraging Expert Support
While many businesses attempt to conduct comparative analysis in-house, partnering with financial experts (like those at Devine Consulting) can provide more accurate and insightful benchmarking. These professionals have access to comprehensive industry data and possess the expertise to interpret complex financial trends.
Final Thoughts
Financial analysis serves as the foundation for informed business decisions. Companies that master various types of financial analysis gain a comprehensive view of their financial health, performance trends, and competitive position. Regular financial analysis helps identify improvement areas, supports strategic planning, and enables proactive risk management.
Conducting thorough financial analysis requires expertise and resources that many businesses lack internally. This is where partnering with financial experts can make a significant difference. Devine Consulting offers comprehensive accounting solutions tailored to various industries.
Our team of professionals uses advanced tools and industry knowledge to provide accurate bookkeeping, insightful financial reporting, and strategic financial planning. We help businesses achieve financial stability, make informed decisions, and plan confidently for the future (represented by our mascot FRANK the Flamingo).