Financial reporting is a critical process for businesses of all sizes. At Devine Consulting, we’ve seen how a well-structured financial reporting process flow chart can transform this complex task into a streamlined operation.
This powerful tool not only enhances accuracy but also boosts efficiency across your entire financial reporting workflow. In this post, we’ll break down the key components of an effective financial reporting process flow chart and show you how to implement one in your organization.
Key Components of a Financial Reporting Flow Chart
A financial reporting flow chart serves as a roadmap that guides organizations through the complex process of creating accurate and timely financial statements. Four critical components form the backbone of an effective financial reporting process.
Data Collection and Entry
Accurate data forms the foundation of any financial report. This stage involves the collection of financial information from various sources (sales records, expense reports, bank statements). Organizations must establish a standardized process for data entry to minimize errors.
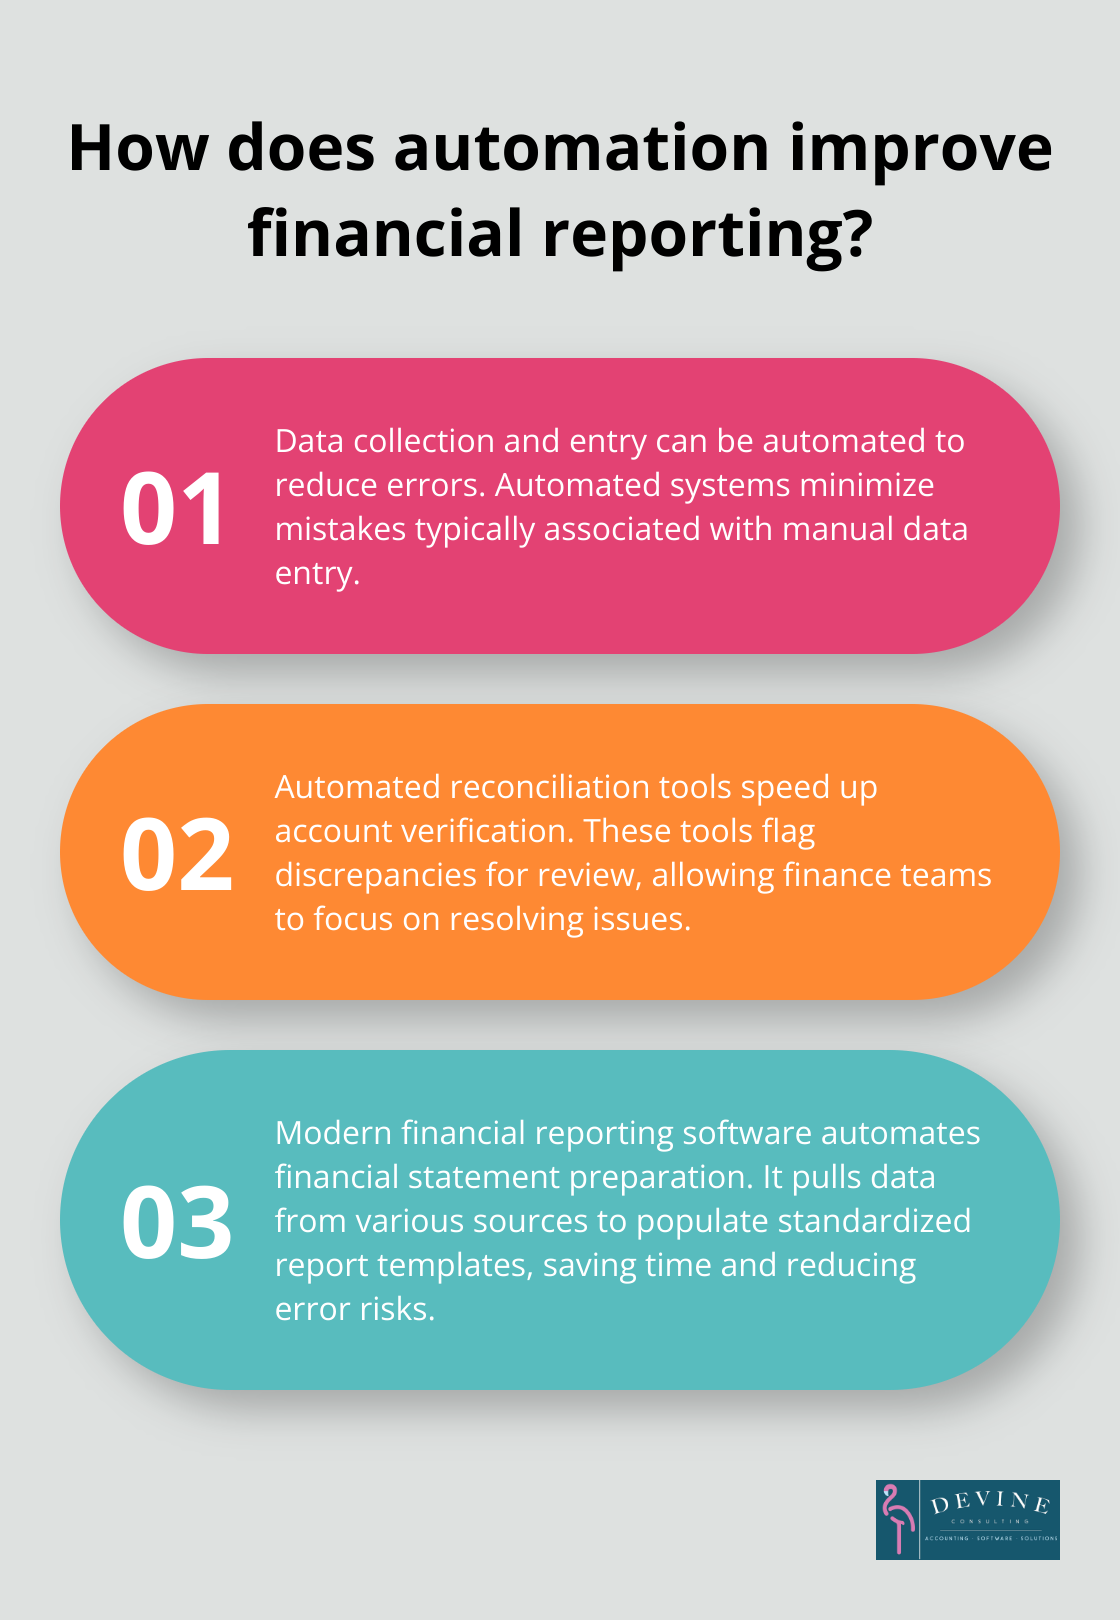
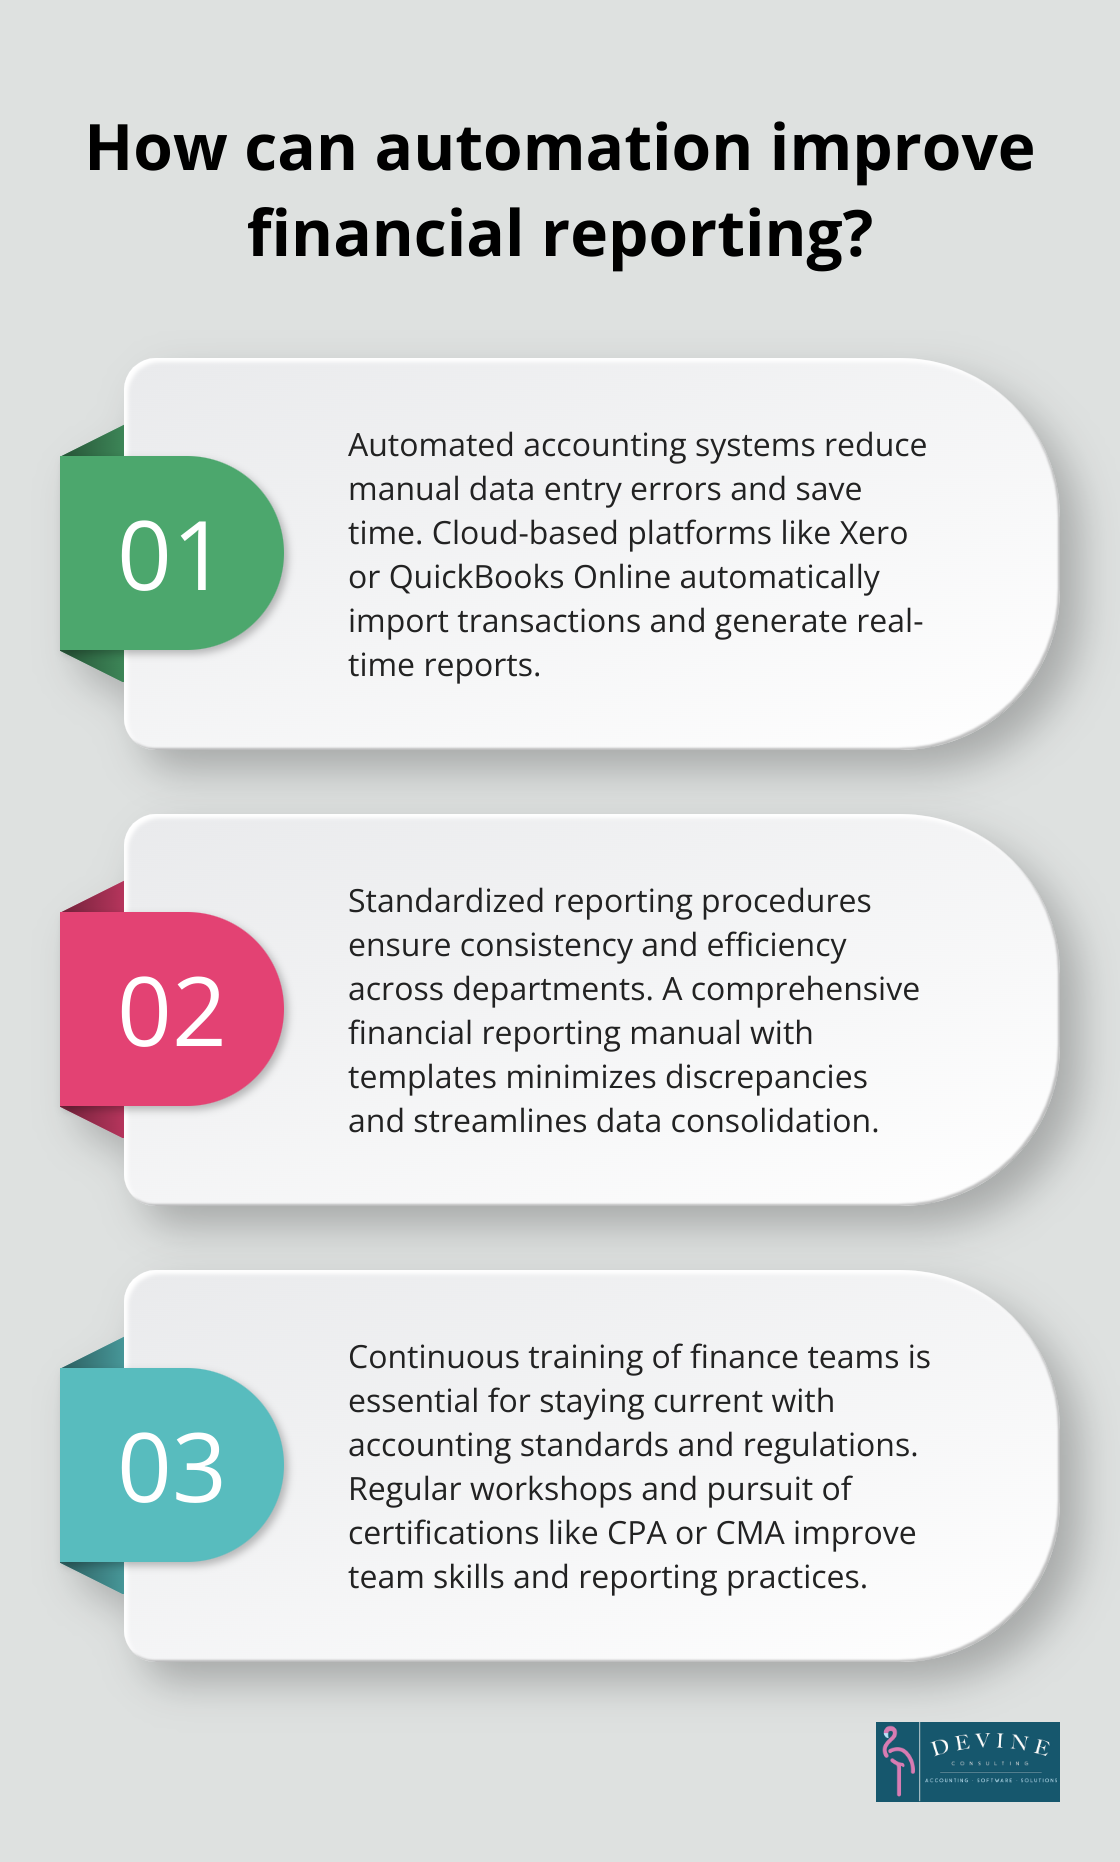
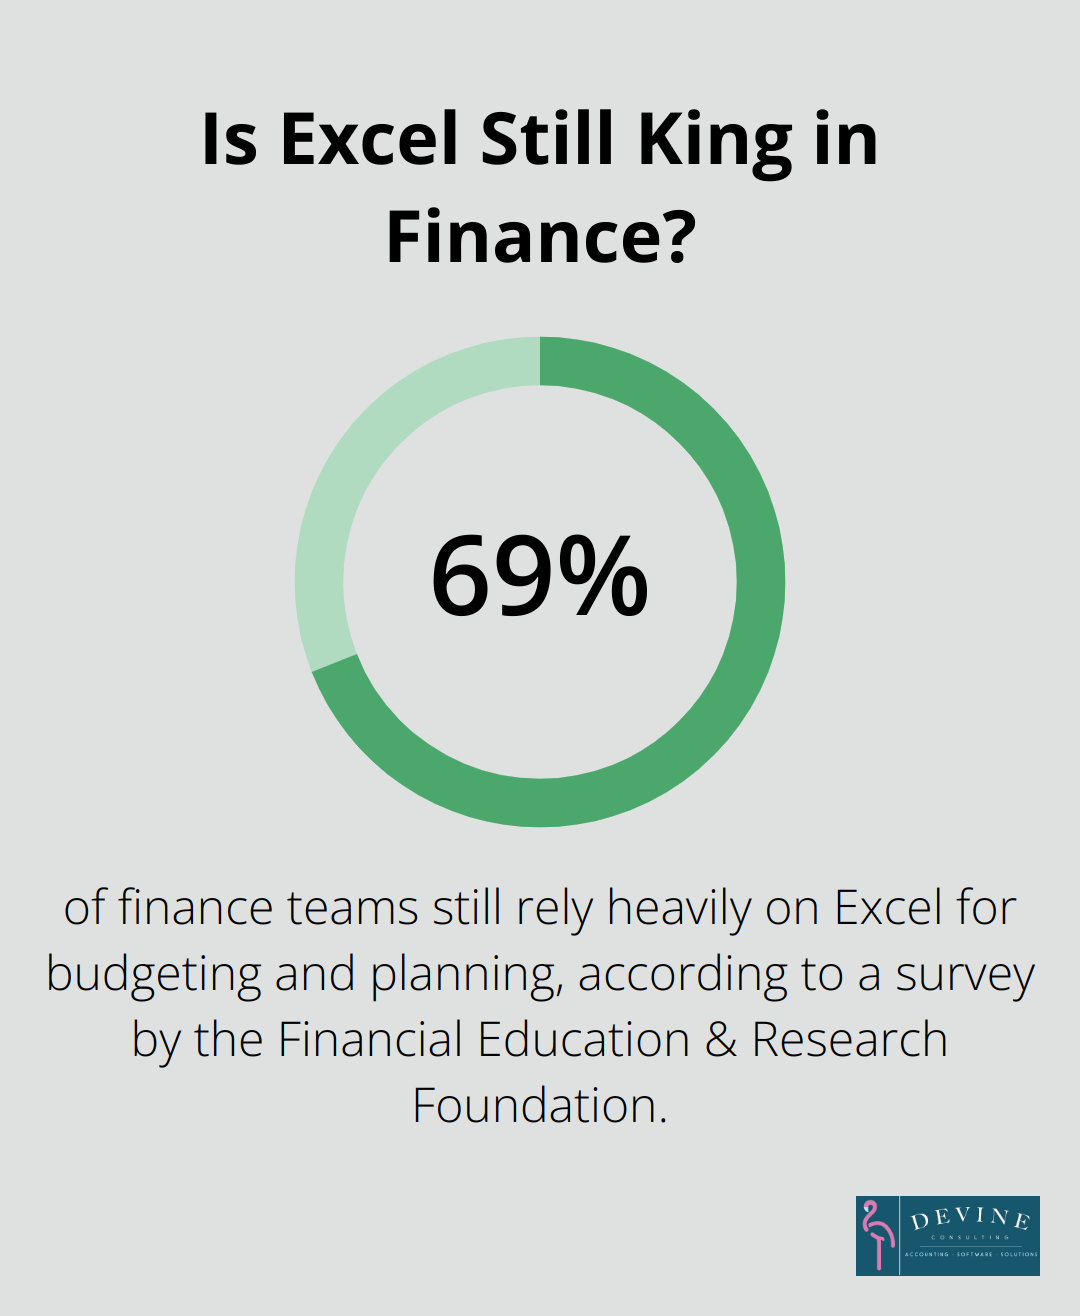
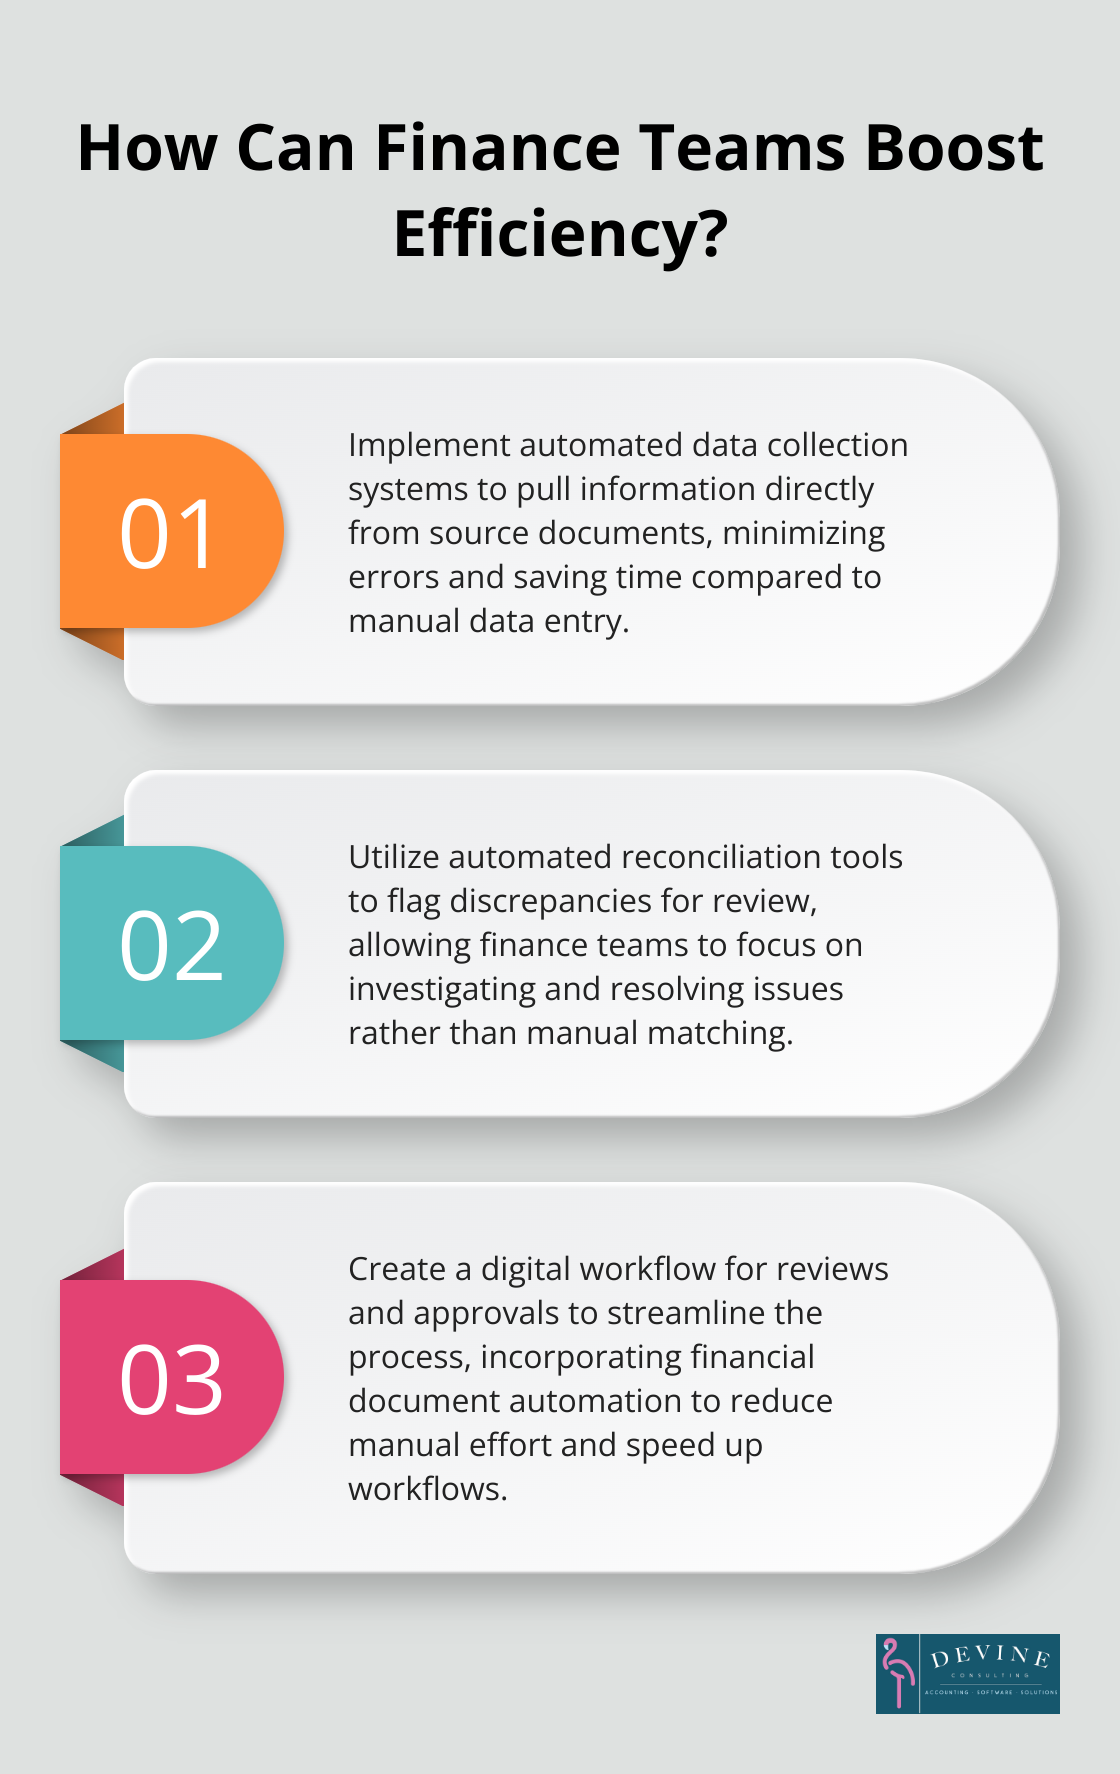
Many companies still use manual data entry, which takes time and increases the risk of mistakes. The implementation of automated data collection systems can pull information directly from source documents. By using automated systems, companies can minimize the likelihood of errors that typically occur with manual data entry or calculations.
Account Reconciliation
After data collection, companies must verify its accuracy through account reconciliation. This process compares internal financial records with external statements, such as bank statements or supplier invoices.
Automated reconciliation tools speed up this process significantly. These tools flag discrepancies for review, which allows finance teams to focus on investigating and resolving issues rather than manual matching.
Financial Statement Preparation
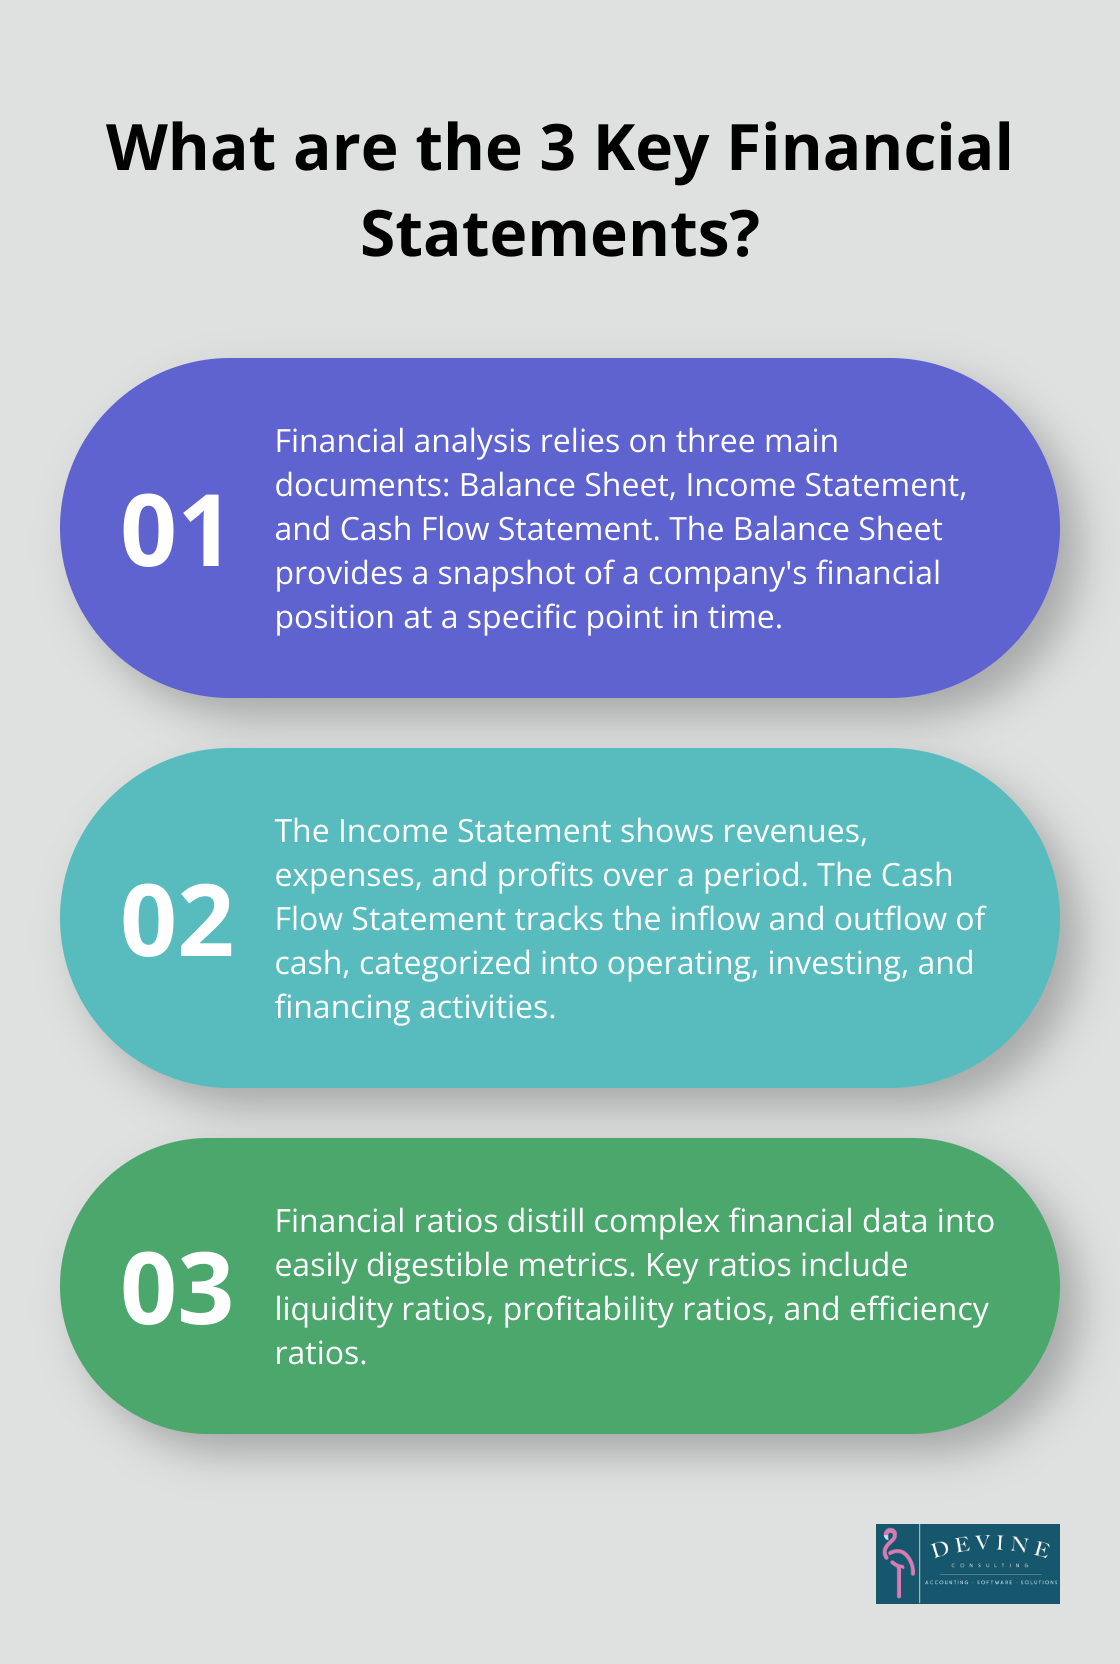
With reconciled accounts, the next step involves the preparation of financial statements. This includes the creation of the balance sheet, income statement, and cash flow statement.
Modern financial reporting software automates much of this process. It pulls data from various sources to populate standardized report templates. This approach not only saves time but also reduces the risk of errors from manual data entry or formula mistakes in spreadsheets.
Review and Approval Process
A thorough review and approval process ensures the accuracy and completeness of financial reports before their distribution to stakeholders or regulatory bodies.
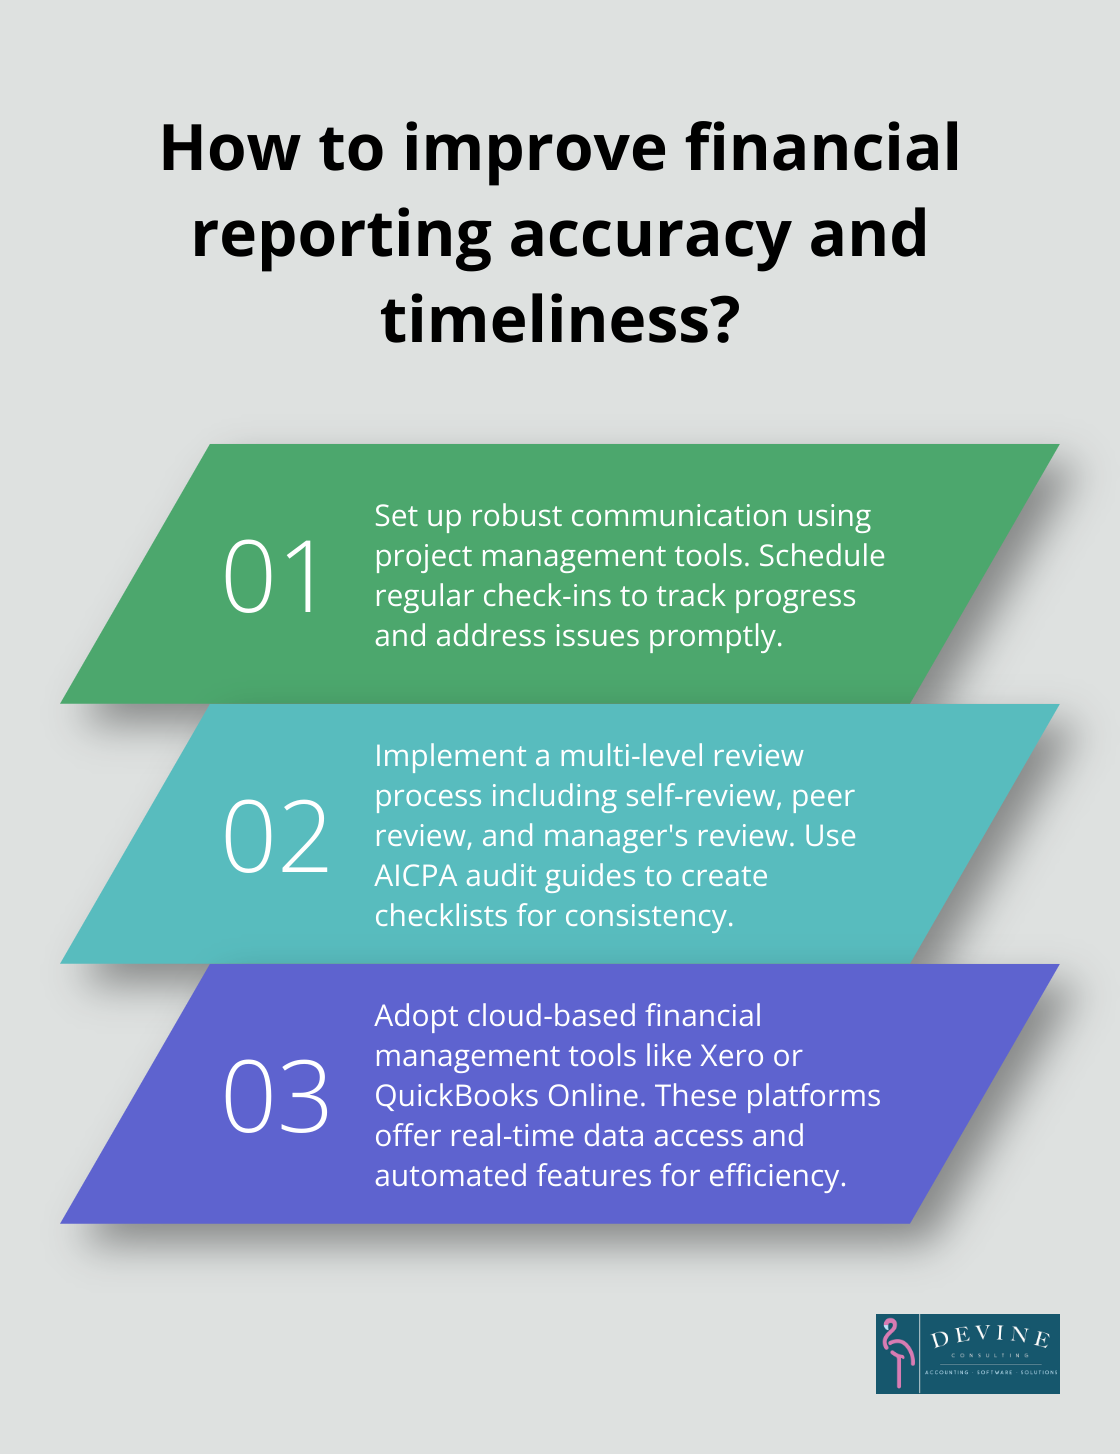
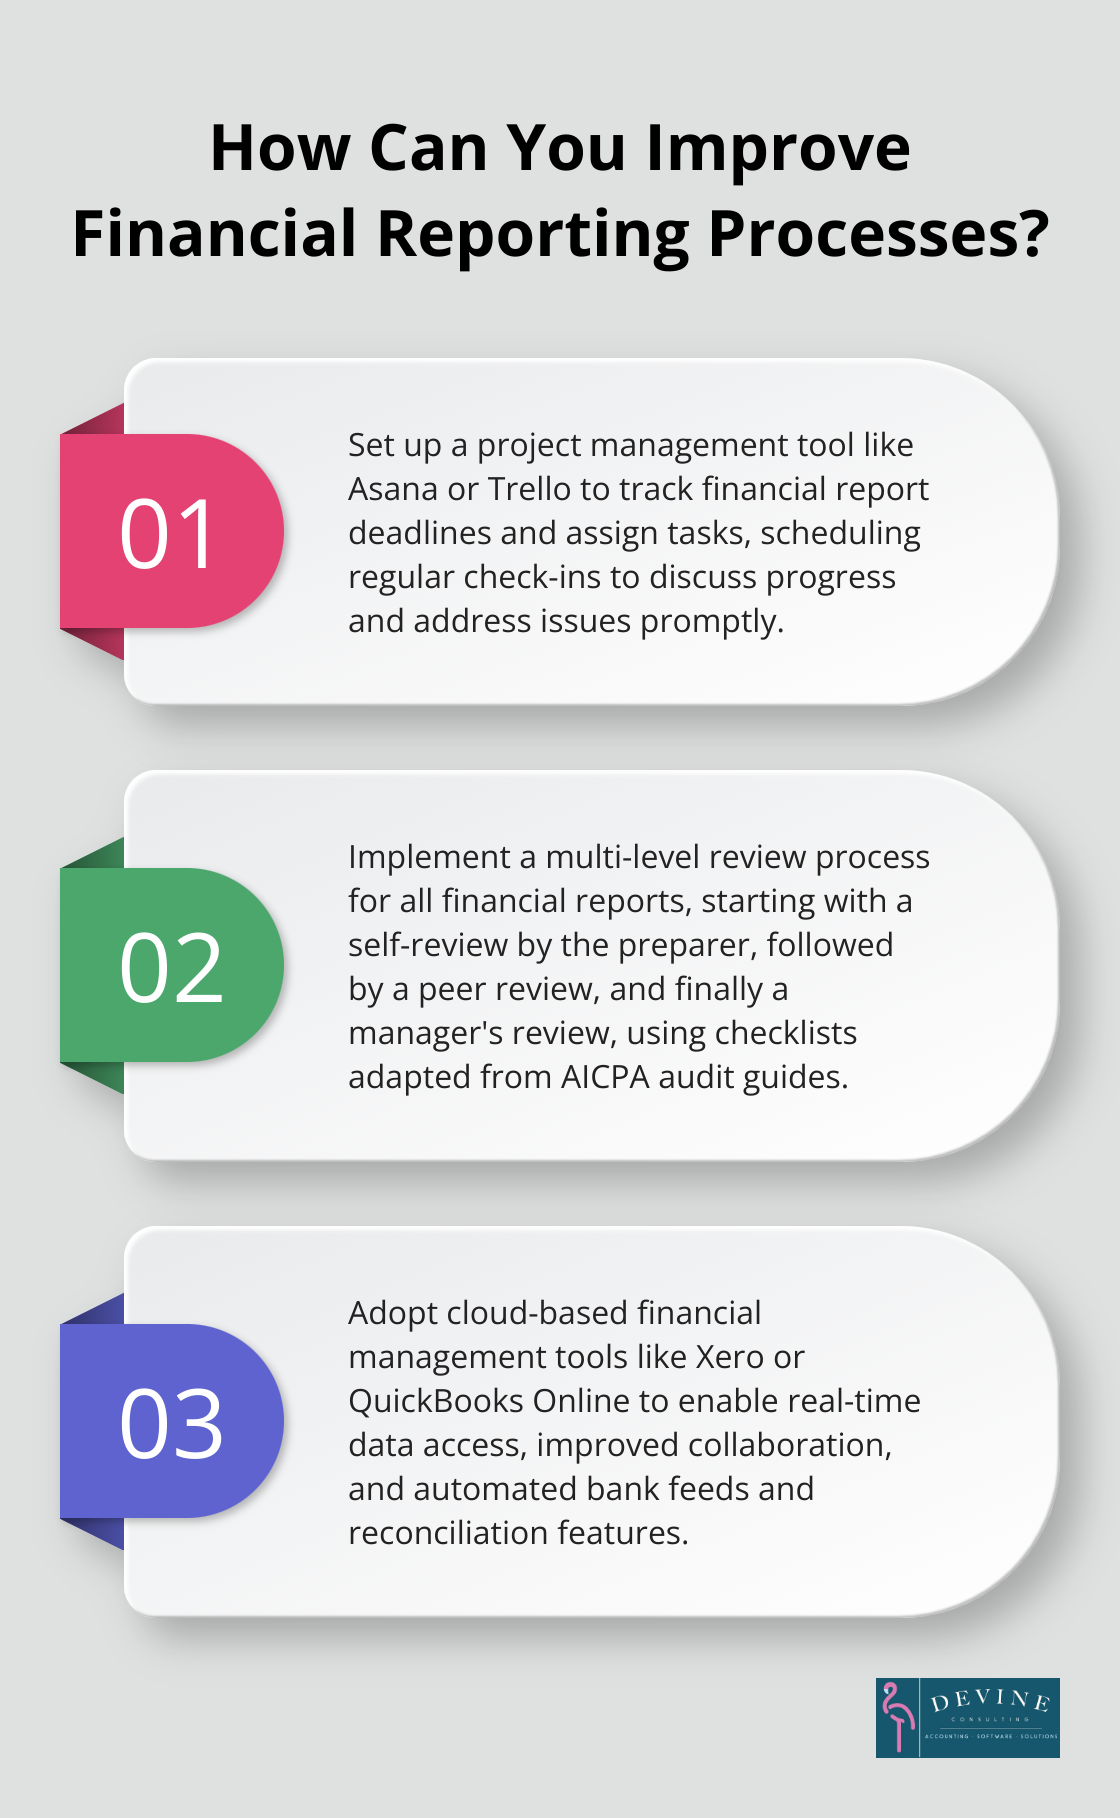
The implementation of a digital workflow for reviews and approvals streamlines this process. Financial document automation streamlines document processing, reducing manual effort, minimizing errors, and speeding up workflows.
The incorporation of these key components into a financial reporting flow chart creates a more efficient and accurate reporting process. The next section will explore the steps to create an effective financial reporting flow chart that leverages these components for optimal results.
How to Create an Effective Financial Reporting Flow Chart
Creating an effective financial reporting flow chart requires careful planning and execution. This strategic process will streamline your financial reporting workflows and enhance overall efficiency. Follow this step-by-step guide to craft a flow chart that will transform your financial reporting process.
Conduct a Comprehensive Process Audit
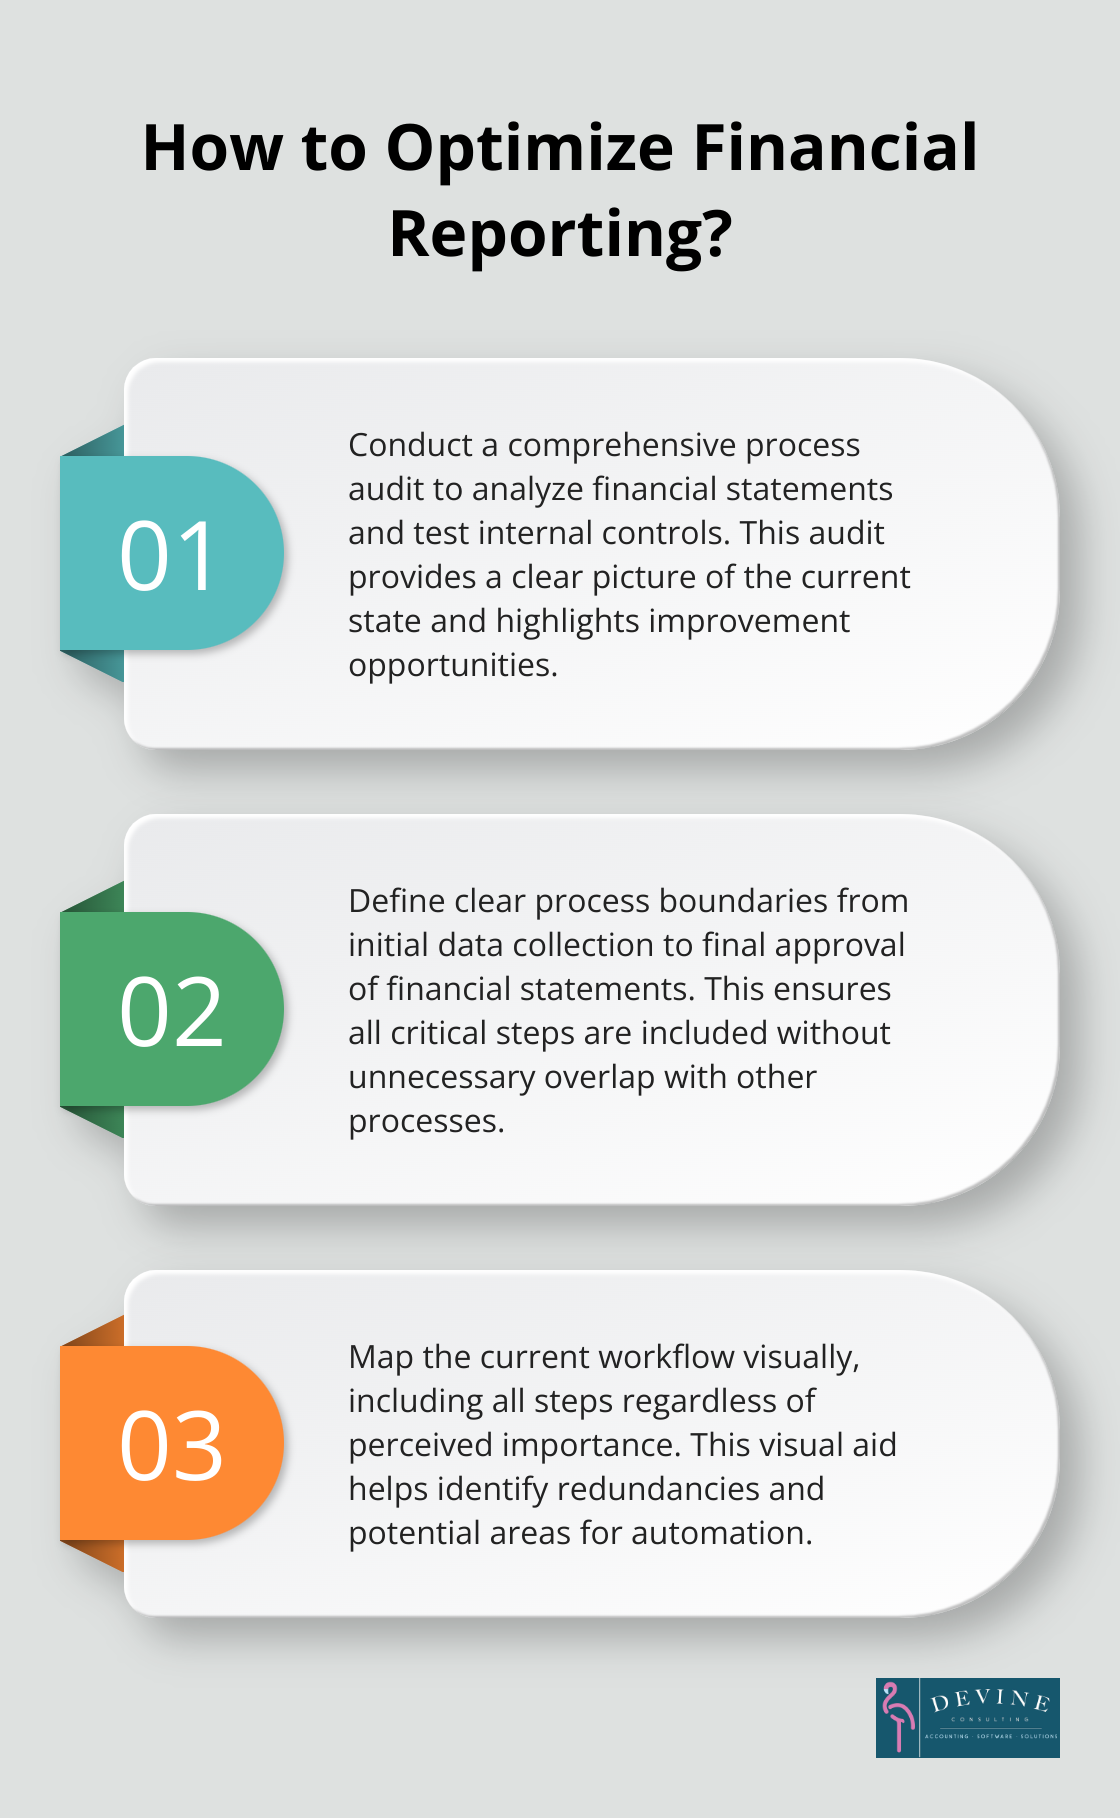
Start with a thorough audit of your current financial reporting process. Conduct a Comprehensive Process Audit by analyzing financial statements, testing internal controls, sampling transactions, and verifying the existence and accuracy of financial data. This audit will provide a clear picture of your current state and highlight opportunities for improvement.
Define Clear Process Boundaries
Establish clear start and end points for your financial reporting process. Your flow chart might begin with initial data collection and end with the final approval of financial statements. These boundaries ensure that all critical steps are included without unnecessary overlap with other business processes.
Map the Current Workflow
Create a visual representation of your current workflow using the information from your audit. Start with a simple sketch and refine it gradually. Include all steps, regardless of their perceived importance. This visual aid will help identify redundancies, unnecessary steps, and potential areas for automation.
Identify Key Decision Points and Controls
Highlight critical decision points within your process where the workflow may branch based on certain conditions (e.g., steps to take if a discrepancy is found during reconciliation). Pinpoint key control points where accuracy and compliance checks occur. These controls maintain the integrity of your financial reports.
Integrate Technology and Automation
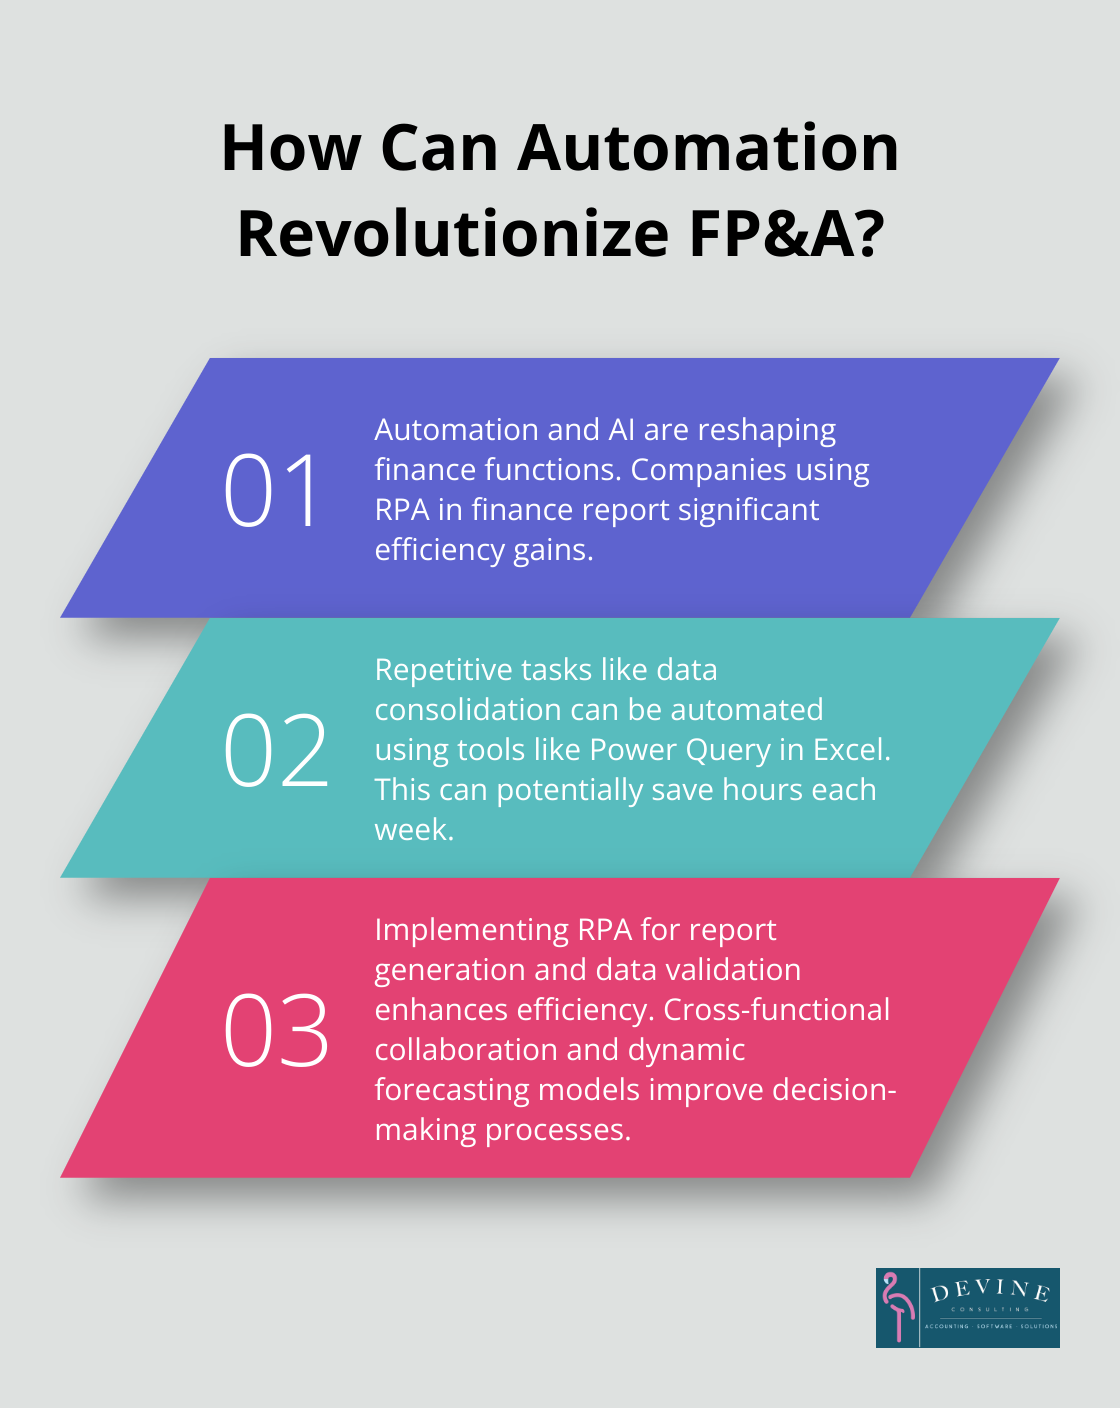
Look for opportunities to incorporate technology and automation into your flow chart. This might include automated data collection systems, reconciliation tools, or digital approval workflows. Finance reporting automation simplifies compliance by automating audit trails, reducing human error, and safeguarding sensitive financial data.
The creation of an effective financial reporting flow chart is an ongoing process of refinement and optimization. As you move forward with implementation, you’ll discover the numerous benefits this powerful tool brings to your organization’s financial records and reporting process.
How a Financial Reporting Flow Chart Boosts Your Business
A financial reporting flow chart transforms financial operations for businesses across various industries. This powerful tool offers numerous benefits that extend beyond the finance department, impacting an organization’s overall efficiency and decision-making capabilities.
Error Reduction and Accuracy Improvement
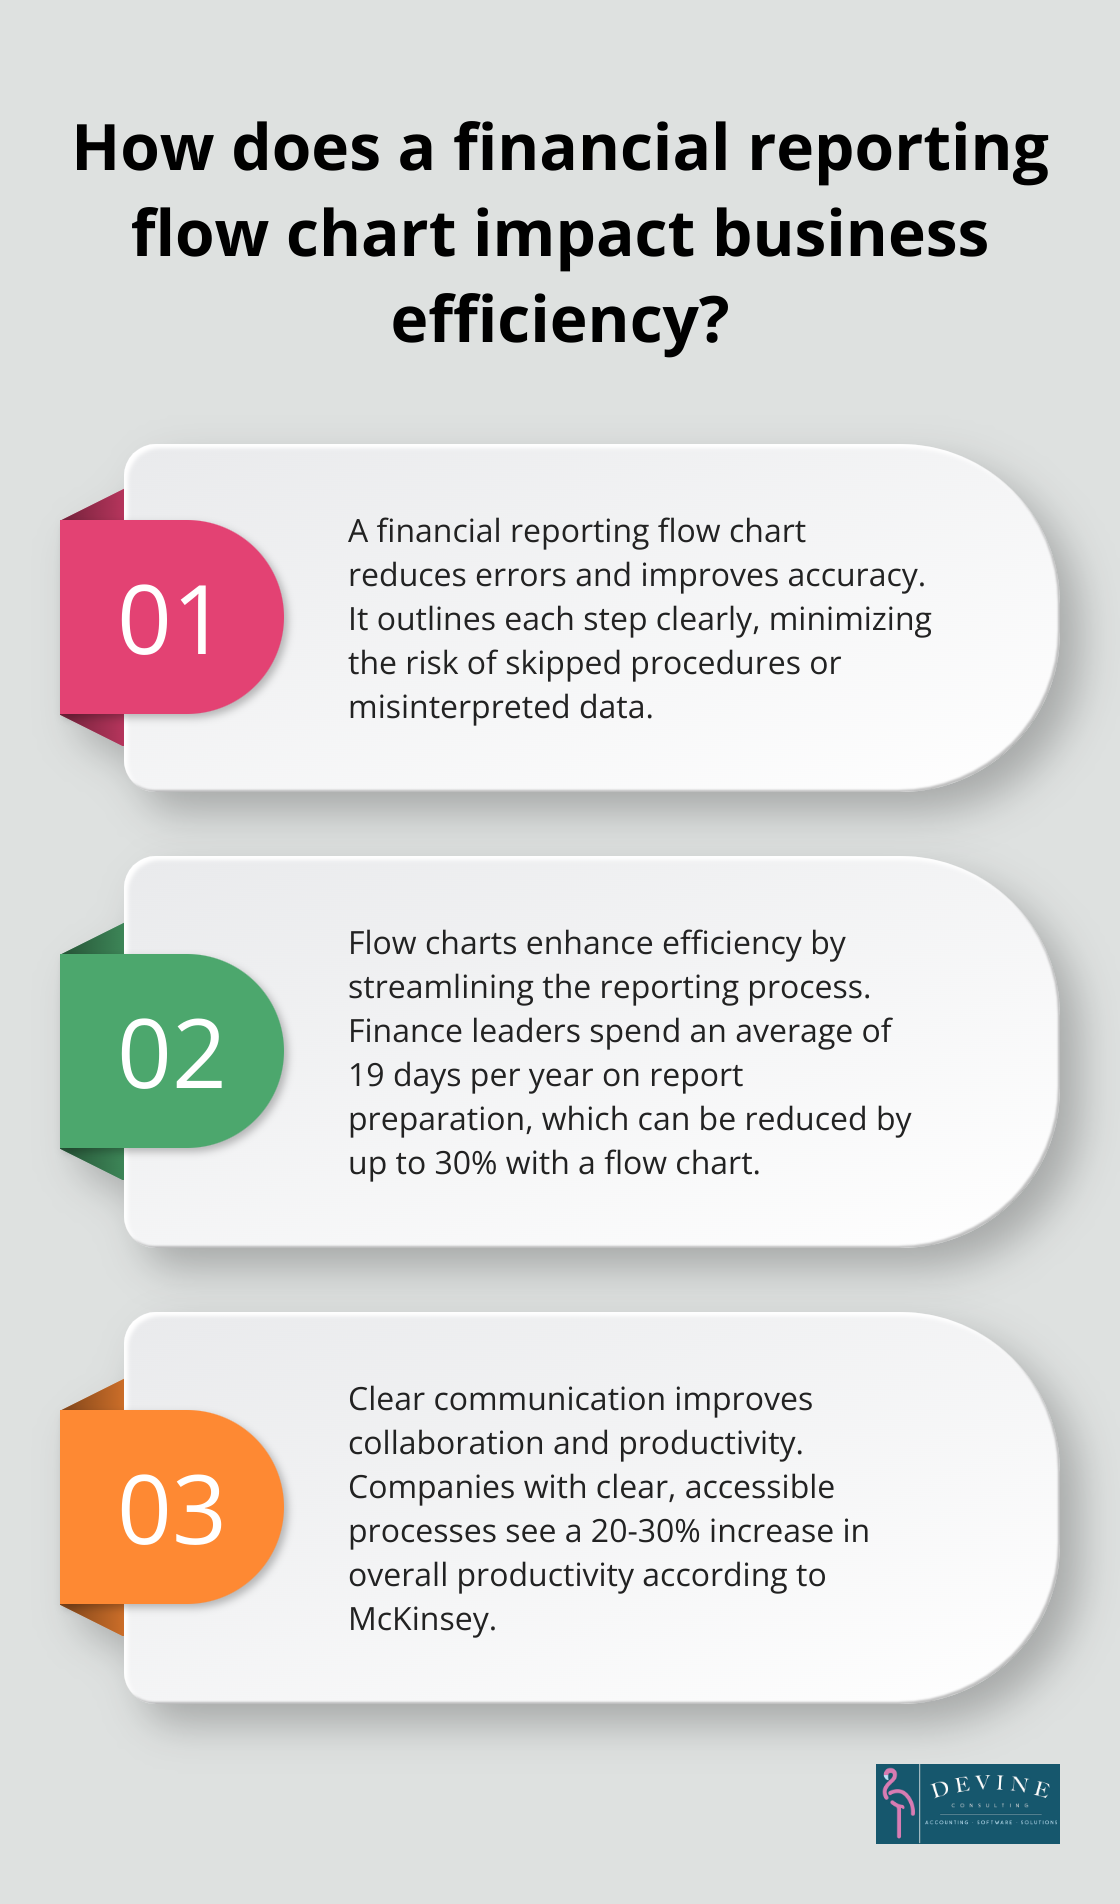
A well-designed flow chart acts as a safeguard against common reporting mistakes. It outlines each step of the process clearly, which minimizes the risk of skipped procedures or misinterpreted data. A study by the American Accounting Association examined the financial reporting consequences of a rigid accounting rule in China under which the fiscal year-end is uniform for all companies.
Efficiency Enhancement
A flow chart helps businesses save both time and money. It streamlines the reporting process, which significantly reduces the hours spent on financial tasks. A survey by Robert Half Management Resources revealed that finance leaders spend an average of 19 days per year on report preparation. A flow chart can cut this time by up to 30%, which frees up valuable resources for strategic activities.
Communication Clarity
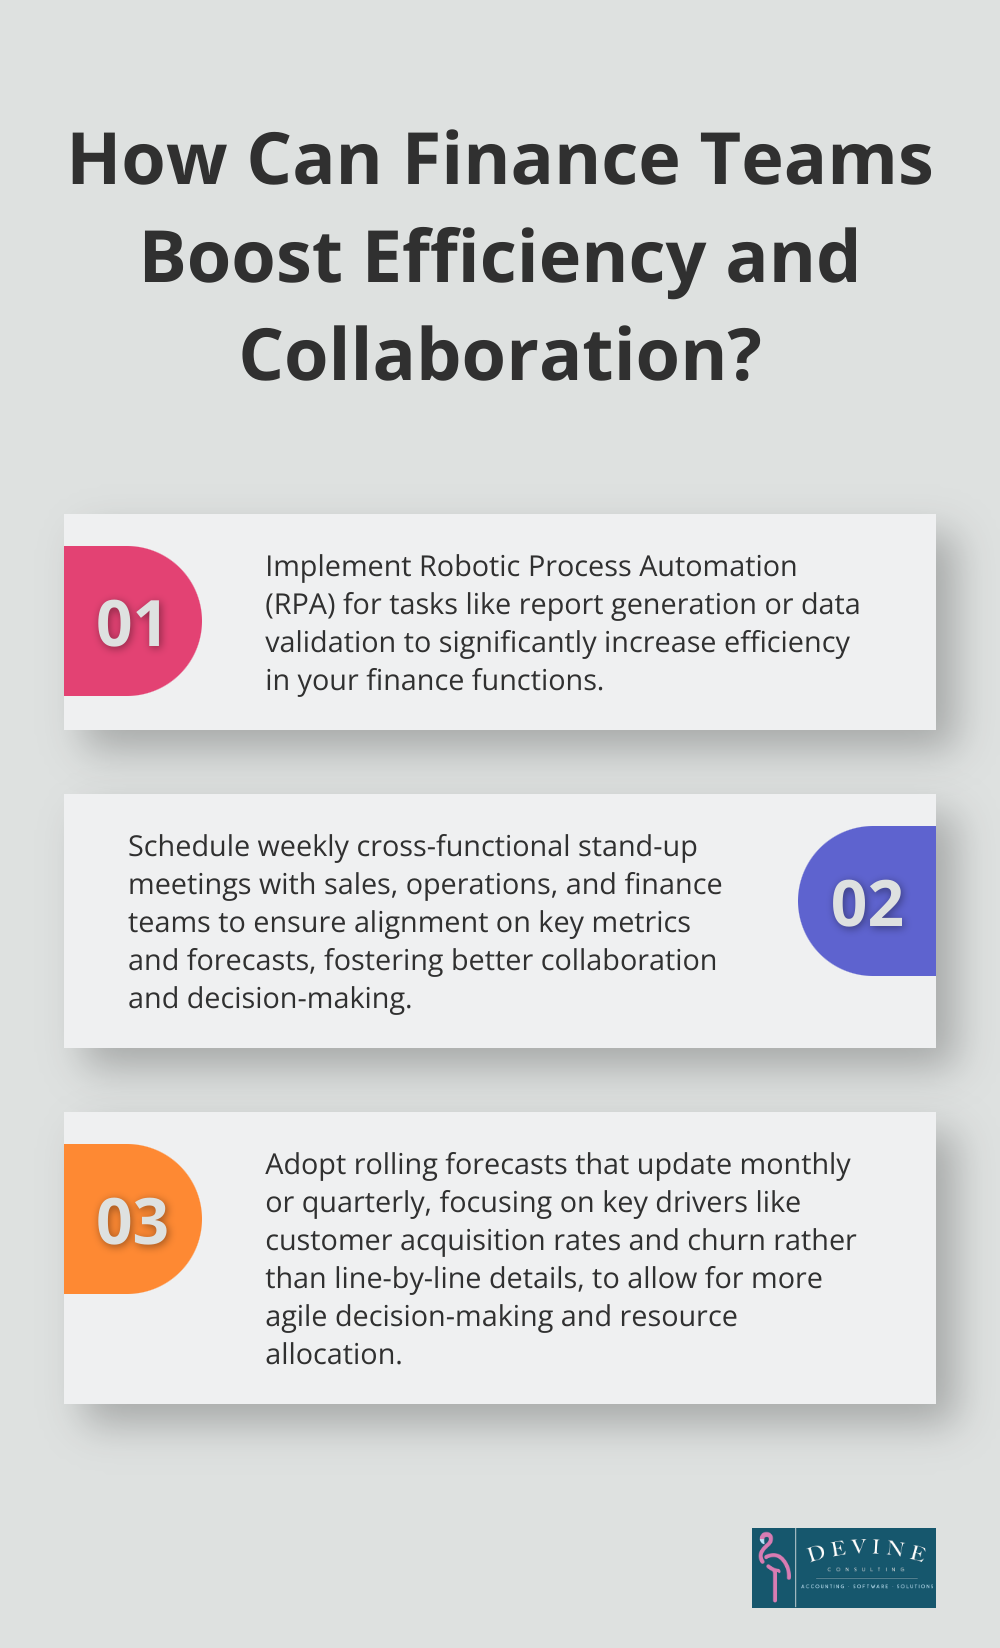
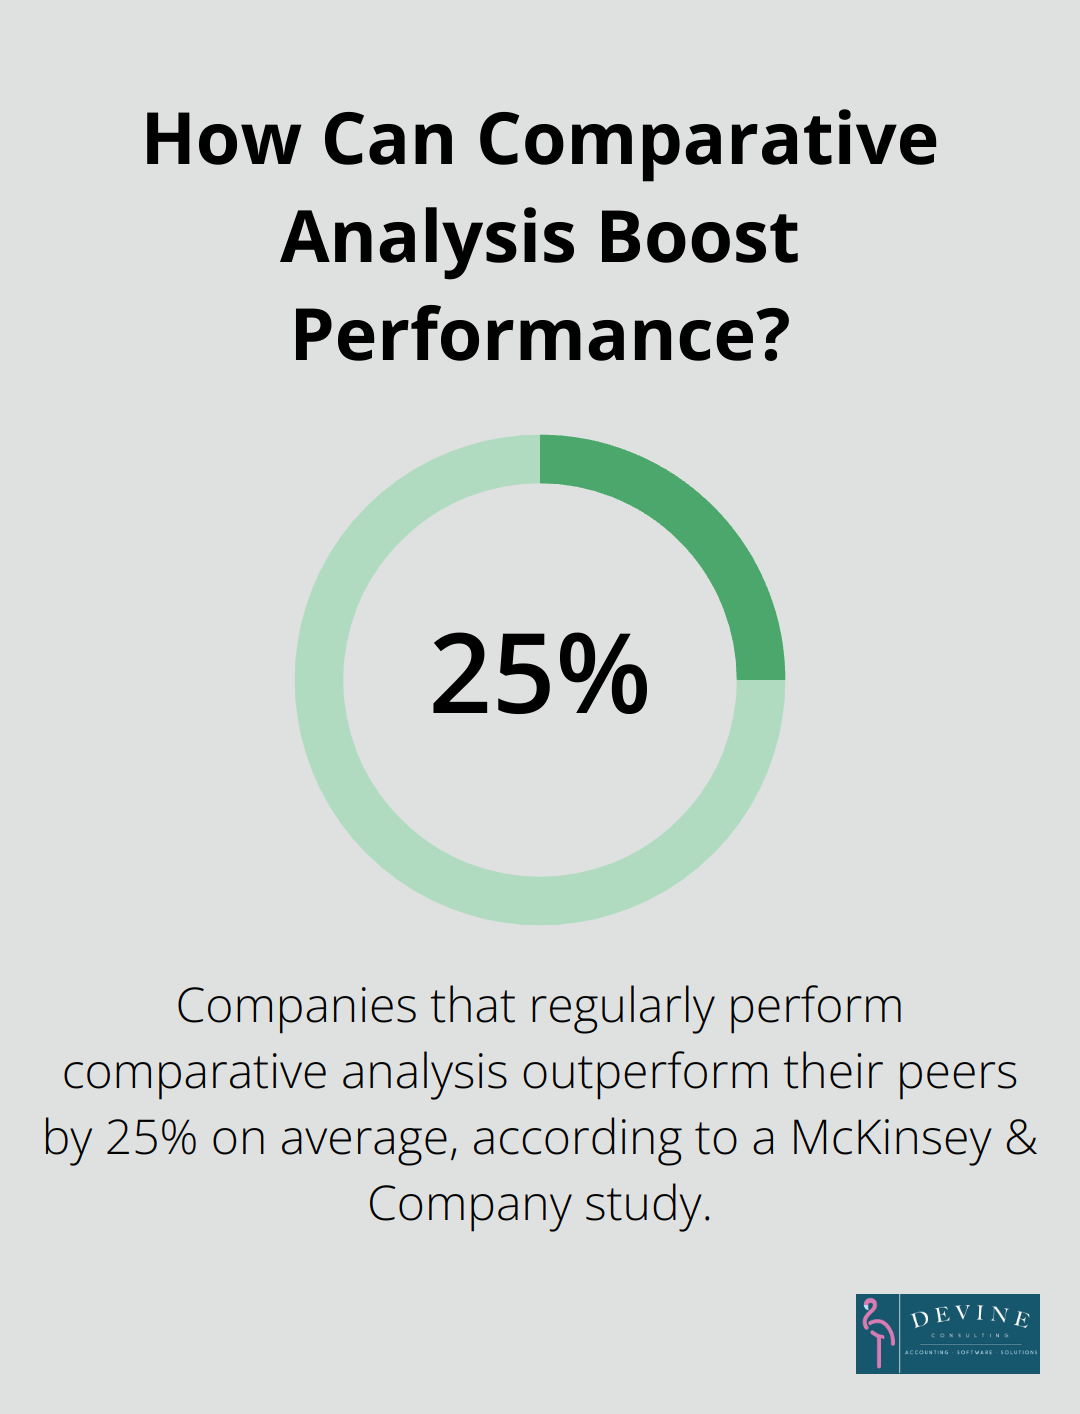
When all team members understand their roles and responsibilities, collaboration improves. A visual representation of the reporting process ensures this clarity. According to a report by McKinsey, companies with clear, accessible processes see a 20-30% increase in overall productivity.
Bottleneck Identification and Resolution
A flow chart functions like an X-ray for financial processes, revealing inefficiencies that might otherwise remain hidden. The mapping of each step allows for easy identification of areas where tasks stall or resources remain underutilized. This visibility enables targeted improvements, potentially reducing process cycle times by up to 50% (as noted in a case study by the Association for Financial Professionals).
Continuous Improvement Facilitation
The implementation of a financial reporting flow chart creates a foundation for ongoing process refinement. Regular reviews of the chart allow teams to identify new opportunities for automation, streamlining, or error reduction. This proactive approach to process management (often overlooked in traditional setups) can lead to compounded efficiency gains over time.
Final Thoughts
Financial reporting process flow charts transform financial operations for modern businesses. These visual roadmaps enhance accuracy, efficiency, and transparency across organizations. Companies that implement well-designed flow charts reduce errors, save time, and identify areas for continuous improvement in their reporting processes.
The future of financial reporting will be shaped by artificial intelligence and machine learning. These technologies will automate complex tasks, provide real-time insights, and enable predictive analytics for financial forecasting. As regulations evolve, adaptable and robust flow charts will become essential for maintaining compliance and operational excellence.
Devine Consulting understands the power of structured financial processes. Our accounting solutions can help businesses implement effective financial reporting flow charts (tailored for various industries). We strive to ensure companies meet current reporting standards and prepare for future challenges in financial management.